US Greenhouse Gas Emissions
Greenhouse gas
- Greenhouse gas absorbs and emits radiant energy in the thermal infrared range, causing the greenhouse effect. The primary greenhouse gases in the Earth's atmosphere are water vapor, carbon dioxide, methane, nitrous oxide, and ozone. Without greenhouse gases, the average temperature of the Earth's surface would be about −18 °C instead of the current average of 15 °C.
- The atmospheres of Venus, Mars, and Titan also contain greenhouse gases. Since the start of the Industrial Revolution, human activities have increased the concentration of carbon dioxide in the atmosphere by more than 50%, from 280 ppm in 1750 to 421 ppm in 2022. in such a high atmosphere more than 3 million years ago. This increase has occurred despite the absorption of more than half of emissions by various natural carbon sinks in the carbon cycle. At current rates of greenhouse gas emissions, temperatures could rise by 2°C, which the United Nations Intergovernmental Panel on Climate Change says is the upper limit to avoid "dangerous" levels in 2050.
- The majority of anthropogenic carbon dioxide emissions come from burning fossil fuels, mainly coal, petroleum, and natural gas, with additional contributions from cement production, manufacturing fertilizer production, deforestation, and other changes in land use. In the current world, the US Environmental Protection Agency estimates that 27% of all US greenhouse gas emissions are related to transportation.
Climate Change Indicators: US Greenhouse Gas Emissions
This indicator defines greenhouse gas emissions in the US.
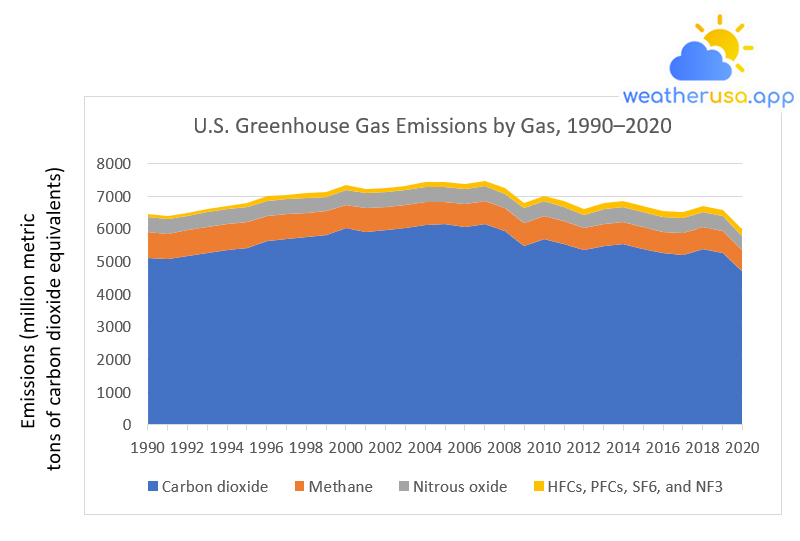
Figure 1. US Greenhouse Gas Emissions by Gas, 1990–2020

This figure shows emissions of carbon dioxide, methane, nitrous oxide, and fluorinated gases in the United States from 1990 to 2020. For consistency, emissions are expressed in million metric tons of carbon dioxide equivalents. * HFCs are hydrofluorocarbons, PFCs are perfluorocarbons, SF6 is sulfur hexafluoride, and NF3 is nitrogen trifluoride.
| Year | Carbon dioxide | Methane | Nitrous oxide | HFCs, PFCs, SF6, and NF3 |
| 1990 | 5122.496 | 780.8141 | 450.4734 | 99.66646 |
| 1991 | 5064.987 | 786.2161 | 441.0532 | 90.68251 |
| 1992 | 5175.22 | 785.9486 | 440.8427 | 95.2788 |
| 1993 | 5274.363 | 774.9709 | 469.0583 | 95.00393 |
| 1994 | 5365.579 | 781.5305 | 454.6929 | 98.97596 |
| 1995 | 5427.798 | 773.1787 | 466.5343 | 117.8522 |
| 1996 | 5616.431 | 766.961 | 478.5347 | 128.9991 |
| 1997 | 5691.865 | 753.36 | 464.561 | 136.4274 |
| 1998 | 5737.129 | 739.5129 | 465.3564 | 152.8347 |
| 1999 | 5810.331 | 722.7878 | 455.1502 | 149.8713 |
| 2000 | 6016.351 | 718.0724 | 442.3164 | 150.8538 |
| 2001 | 5911.989 | 711.3831 | 457.9544 | 137.8369 |
| 2002 | 5952.699 | 704.241 | 456.4295 | 145.7881 |
| 2003 | 6015.804 | 703.8155 | 457.294 | 136.9144 |
| 2004 | 6117.963 | 698.6691 | 467.3439 | 144.4719 |
| 2005 | 6137.603 | 697.4591 | 453.333 | 146.4324 |
| 2006 | 6057.163 | 703.2787 | 450.9811 | 149.3783 |
| 2007 | 6135.287 | 706.2883 | 461.1799 | 161.031 |
| 2008 | 5918.869 | 714.4237 | 444.6879 | 162.6633 |
| 2009 | 5482.978 | 702.5099 | 443.4118 | 158.3651 |
| 2010 | 5681.392 | 705.3118 | 452.7094 | 168.0291 |
| 2011 | 5546.629 | 679.7715 | 443.4109 | 175.2758 |
| 2012 | 5345.454 | 674.5752 | 414.6174 | 171.8768 |
| 2013 | 5480.926 | 670.0762 | 461.7222 | 171.7697 |
| 2014 | 5528.871 | 666.0725 | 471.7697 | 176.6423 |
| 2015 | 5376.578 | 666.7138 | 466.4668 | 179.2476 |
| 2016 | 5251.758 | 657.5922 | 449.1997 | 179.3215 |
| 2017 | 5210.958 | 663.7583 | 444.5771 | 181.6823 |
| 2018 | 5376.657 | 671.0976 | 457.7172 | 182.0405 |
| 2019 | 5259.144 | 668.8267 | 456.8089 | 186.9463 |
| 2020 | 4715.691 | 650.4192 | 426.0539 | 189.1901 |
Figure 1. U.S. Greenhouse Gas Emissions by Gas, 1990–2020
Data source: U.S. EPA, 2022
Web update: July 2022
Units: million metric tons of CO2 equivalents
Figure 2. US Greenhouse Gas Emissions and Emissions by Economic Sector, 1990–2020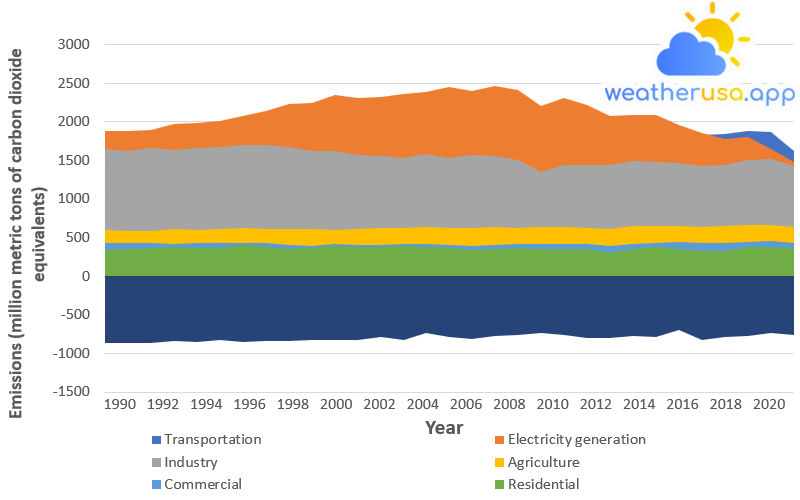
U.S. Greenhouse Gas Emissions and Sinks by Economic Sector, 1990–2020
This figure shows greenhouse gas emissions and sinks by source in the United States from 1990 to 2020. For consistency, emissions are expressed in million metric tons of carbon dioxide equivalent. All electrical energy emissions are grouped in the "Electricity generation" sector, so other sectors, such as "Residential" and "Commercial," only show non-electrical sources such as burning oil or gas for heating. The totals do not precisely match Figure 1, as the economic sectors shown here do not include emissions from US territories outside the 50 states.
| Year | Transportation | Electricity generation | Industry | Agriculture | Commercial | Residential |
Land use, land-use change, and forestry (net sink)
|
| 1990 | 1.526.434.289 | 1.880.548.218 | 1.652.361.348 | 5.967.782.036 | 4.271.097.946 | 3.450.707.892 | -8.606.250.574 |
| 1991 | 1.480.303.906 | 1.874.832.994 | 1.625.461.259 | 5.874.933.791 | 4.343.210.719 | 3.546.897.497 | -8.699.082.889 |
| 1992 | 1.539.881.716 | 1.890.103.637 | 1.662.343.992 | 588.301.071 | 4.299.390.699 | 3.612.220.248 | -8.624.402.032 |
| 1993 | 1.576.887.693 | 1.965.574.487 | 1.631.906.633 | 6.163.677.197 | 4.233.667.576 | 3.726.124.988 | -844.206.428 |
| 1994 | 163.184.286 | 1.990.300.202 | 1.657.477.536 | 6.034.730.438 | 4.265.831.602 | 3.632.601.466 | -8.575.259.735 |
| 1995 | 166.701.978 | 2.006.877.479 | 1.675.133.984 | 6.156.694.674 | 4.256.963.637 | 3.675.235.211 | -8.317.775.006 |
| 1996 | 1.723.249.166 | 2.079.434.226 | 1.705.045.256 | 6.229.079.529 | 4.333.072.282 | 3.994.548.027 | -8.521.428.676 |
| 1997 | 174.984.933 | 2.144.903.577 | 170.517.277 | 6.113.285.207 | 4.257.958.774 | 3.808.286.589 | -8.334.407.232 |
| 1998 | 1.792.295.978 | 2.231.446.285 | 1.677.755.098 | 618.246.994 | 4.005.410.056 | 3.468.732.536 | -8.352.578.601 |
| 1999 | 1.863.292.087 | 2.244.837.093 | 1.627.052.157 | 6.092.897.438 | 3.969.265.022 | 3.666.844.584 | -8.280.496.898 |
| 2000 | 191.355.078 | 2.351.125.685 | 1.616.991.263 | 5.948.543.002 | 4.111.952.894 | 3.879.925.386 | -8.252.288.316 |
| 2001 | 1.885.434.887 | 2.311.387.024 | 1.569.909.847 | 6.155.265.572 | 4.002.090.783 | 3.780.768.839 | -8.288.079.892 |
| 2002 | 1.925.980.857 | 2.326.759.449 | 15.509.615 | 6.186.742.483 | 401.730.691 | 3.752.866.689 | -7.905.485.356 |
| 2003 | 1.933.326.749 | 2.357.952.283 | 1.529.061.153 | 6.189.622.898 | 4.179.651.174 | 3.937.289.434 | -8.207.858.422 |
| 2004 | 1.965.852.074 | 2.390.768.614 | 1.577.981.113 | 631.722.629 | 4.157.778.278 | 381.852.435 | -7.294.523.162 |
| 2005 | 1.975.495.129 | 245.673.709 | 153.617.642 | 6.262.532.137 | 4.054.424.321 | 3.710.155.287 | -7.897.931.676 |
| 2006 | 1.975.865.366 | 2.401.231.383 | 1.570.640.402 | 6.257.865.014 | 3.919.017.623 | 3.343.094 | -8.171.760.559 |
| 2007 | 1.974.426.677 | 2.467.226.239 | 1.560.386.569 | 6.427.207.481 | 4.058.560.039 | 3.552.548.552 | -7.763.550.104 |
| 2008 | 187.090.605 | 2.414.114.945 | 1.501.553.646 | 6.310.310.542 | 4.131.665.118 | 3.639.069.817 | -7.664.712.252 |
| 2009 | 1.796.295.049 | 2.198.273.322 | 1.345.926.535 | 6.328.604.701 | 4.169.037.851 | 3.545.451.475 | -73448.90% |
| 2010 | 1.802.276.352 | 2.313.956.993 | 143.877.876 | 6.410.292.595 | 4.192.903.163 | 3.555.391.842 | -7.610.363.768 |
| 2011 | 176.859.536 | 2.211.767.283 | 1.443.335.476 | 6.227.172.211 | 4.150.676.612 | 3.490.938.093 | -8.007.290.152 |
| 2012 | 1.748.912.232 | 207.378.562 | 1.440.040.968 | 6.064.525.784 | 3.960.250.101 | 3.069.431.239 | -7.999.251.081 |
| 2013 | 1.751.515.531 | 2.092.343.183 | 1.489.536.433 | 6.451.572.756 | 4.193.419.598 | 3.577.310.858 | -7.674.142.623 |
| 2014 | 1.785.407.074 | 20.925.328 | 1.474.546.661 | 6.541.143.399 | 4.296.005.259 | 3.782.769.922 | -7.813.816.316 |
| 2015 | 1.793.399.368 | 1.952.725.752 | 1.464.017.871 | 6.561.010.385 | 4.420.847.199 | 351.469.522 | -7.000.664.105 |
| 2016 | 1.828.045.564 | 1.860.497.992 | 1.424.355.203 | 6.434.202.707 | 4.269.066.423 | 3.278.126.347 | -8.266.421.699 |
| 2017 | 1.845.162.609 | 178.055.203 | 1.446.687.191 | 6.443.957.277 | 4.284.860.499 | 3.298.809.699 | -7.812.093.236 |
| 2018 | 1.874.726.295 | 1.799.826.648 | 150.764.746 | 6.579.149.823 | 4.442.334.991 | 3.773.688.578 | -769.266.566 |
| 2019 | 1.874.291.137 | 1.650.961.498 | 1.521.665.941 | 6.638.956.688 | 4.521.397.884 | 3.841.781.584 | -7.304.876.898 |
| 2020 | 1.627.618.555 | 1.482.182.865 | 1.426.194.536 | 6.351.059.605 | 4.253.125.143 | 3.619.522.568 | -7.589.433.076 |
Figure 2. U.S. Greenhouse Gas Emissions and Sinks by Economic Sector, 1990–2020
Data source: U.S. EPA, 2022
Web update: July 2022
Units: million metric tons of CO2 equivalents
Figure 3. US GHG Emissions Per Capita and Per Dollar GDP, 1990–2020
 US GHG Emissions Per Capita and Per Dollar GDP, 1990–2020
This figure shows trends in per capita greenhouse gas emissions from 1990 to 2020, based on the total US population. It also shows trends in emissions per dollar of real GDP. Real GDP is the inflation-adjusted value of all goods and services produced in a country during a given year.
| Year | Real GDP | Population | Emissions per capita | Emissions per $GDP |
| 1990 | 100 | 100 | 100 | 100 |
| 1991 | 99.89174 | 101.388 | 97.55337 | 99.01458 |
| 1992 | 103.4104 | 102.7276 | 98.00612 | 97.35903 |
| 1993 | 106.256 | 103.9908 | 98.54565 | 96.44487 |
| 1994 | 110.5368 | 105.2333 | 98.66881 | 93.93475 |
| 1995 | 113.5039 | 106.4645 | 98.75896 | 92.63401 |
| 1996 | 117.7859 | 107.7463 | 100.5404 | 91.9707 |
| 1997 | 123.024 | 109.0058 | 100.1646 | 88.75113 |
| 1998 | 128.5372 | 110.2559 | 99.71225 | 85.53057 |
| 1999 | 134.6999 | 111.4774 | 99.22162 | 82.11562 |
| 2000 | 140.1919 | 112.5734 | 100.8634 | 80.99283 |
| 2001 | 141.5298 | 113.6095 | 98.46461 | 79.04003 |
| 2002 | 143.93 | 114.577 | 98.17407 | 78.15249 |
| 2003 | 147.9546 | 115.6275 | 98.01483 | 76.59921 |
| 2004 | 153.6546 | 116.6809 | 98.65211 | 74.91355 |
| 2005 | 159.0068 | 117.7889 | 97.80808 | 72.45416 |
| 2006 | 163.4316 | 118.8893 | 95.9379 | 69.79061 |
| 2007 | 166.7174 | 119.9943 | 96.38437 | 69.37232 |
| 2008 | 166.9211 | 121.0277 | 92.70441 | 67.21618 |
| 2009 | 162.5814 | 122.0119 | 86.19869 | 64.68924 |
| 2010 | 166.9855 | 122.8651 | 88.37698 | 65.02627 |
| 2011 | 169.5736 | 123.7335 | 85.7235 | 62.55022 |
| 2012 | 173.441 | 124.5571 | 82.18881 | 59.02408 |
| 2013 | 176.6356 | 125.4335 | 83.81311 | 59.51786 |
| 2014 | 180.6766 | 126.3181 | 83.94826 | 58.6915 |
| 2015 | 185.5664 | 127.1916 | 81.49126 | 55.85606 |
| 2016 | 188.6607 | 127.9639 | 79.1693 | 53.69861 |
| 2017 | 192.9162 | 128.6039 | 78.33075 | 52.2177 |
| 2018 | 198.5472 | 129.1866 | 80.2149 | 52.19259 |
| 2019 | 203.0917 | 130.879 | 77.80677 | 50.14127 |
| 2020 | 196.1772 | 131.7784 | 70.33368 | 47.24534 |
Figure 3. U.S. Greenhouse Gas Emissions per Capita and per Dollar of GDP, 1990–2020
Data source: U.S. EPA, 2022
Web update: July 2022
Units: index value (1990 = 100)
Key Points
- In 2020, US greenhouse gas emissions totaled 5.981 million metric tons of carbon dioxide equivalent. This total represents a 7 percent decrease since 1990 and a 20 percent decrease since 2005 (see Figure 1).
- For the United States, during the period from 1990 to 2020 (see Figure 1):
- Carbon dioxide, the primary greenhouse gas emitted by human activities, decreased by 8 percent.
- Methane emissions were reduced by 17 percent, as emissions from landfills, coal mines, and natural gas systems more than offset increases in emissions from activities such as livestock.
- Nitrous oxide emissions, predominantly from agricultural soil management practices, such as using nitrogen as fertilizer, were reduced by 5 percent.
- Emissions of fluorinated gases released due to commercial, industrial, and domestic uses increased by 90 percent.
- U.S. greenhouse gas emissions decreased by 9 percent from 2019 to 2020. This sharp decline is due mainly to the effects of the coronavirus (COVID-19) pandemic on travel and economic activity. However, the drop also reflects the combined effects of long-term trends in many factors, including population, economic growth, energy markets, technological changes, energy efficiency, and the carbon intensity of energy fuel choices.
- Among the various sectors of the US economy, electricity generation has the largest share of historical emissions - 31 percent of total greenhouse gas emissions since 1990. Transport has historically been the second largest sector, accounting for 26 percent of emissions since 1990 (see Figure 2). Transport has been the most significant industry since 2017.
- Emission sources, unlike emission sources, absorb carbon dioxide from the atmosphere 13 percent of U.S. greenhouse gas emissions in 2020 were offset by net sinks from land use and forestry practices (see Figure 2). An important sink is the net growth of forests, which removes carbon from the atmosphere. Other carbon sinks relate to how people use land, including depositing garden clippings and food scraps in landfills. While the category of land use, land use change, and forestry represents a net carbon dioxide sink overall in the United States, this category also includes sources of emissions from activities such as wildfires, converting land to farmland, and burning biomass.
- Emissions increased at roughly the same rate as the population from 1990 to 2007, causing per capita emissions to remain reasonably constant (see Figure 3). Total and per capita emissions fell from 2007 to 2009, partly due to the decline in US economic production during this time. Emissions decreased from 2010 to 2012 and continued to fall, primarily due to the increased use of natural gas and renewable energy sources to generate electricity and replace more carbon-intensive fuels.
- From 1990 to 2020, greenhouse gas emissions per dollar in the US economy shrank by 53 percent (see Figure 3). This change may reflect increased energy efficiency and structural changes in the economy.
Background
About the Indicator
Data and analysis for this indicator are from the EPA's annual inventory presentation, the U.S. Greenhouse Gas Emissions and Ingestion Inventory: 1990–2020. This indicator is limited to emissions associated with human activities. It began in 1990, a typical base year for global agreements to monitor and reduce greenhouse gas emissions.
Each greenhouse gas has a different lifespan and can retain heat in our atmosphere. Emissions are converted to carbon dioxide equivalents to allow other gases to be compared and added. This step uses each gas's 100-year global warming potential; this measures how much a given amount of gas is estimated to contribute to global warming over a 100-year period after it is released. Carbon dioxide has been assigned a global warming potential equal to 1. This analysis uses the global warming potentials from the Intergovernmental Panel on Climate Change's Fourth Assessment Report.
The global warming potential of methane in this report is 25. This means that one tonne of methane emissions contributes to 25 times more warming than one tonne of carbon dioxide emissions in 100 years. Therefore that tonne of methane emissions is equivalent to 25 tonnes of carbon dioxide equivalent. See the table comparing global warming potentials in the IPCC's Fifth Assessment Report. From an additional point of view, this indicator also shows greenhouse gas emissions concerning economic output and population.
About the Data
Although there are many sources of natural greenhouse gas emissions, this indicator focuses on emissions associated with human activities that are most responsible for the observed formation of these gases in our atmosphere. Although land use, land use change, and forestry emission estimates include emissions from unmanaged lands and sinks due to forest growth, fires, and other factors, this indicator does not include other natural sources, such as methane emissions from unmanaged wetlands.

Weather 01852 - Lowell MA

56°
mist
Feels like 55°05:30/19:53
60°F
/53°F
81%
999 hPa
7 mi
6.91 mph


