Sea surface temperature
Sea surface temperature

Sea or ocean surface temperature is the ocean temperature near the surface. Although the exact meaning of the surface varies according to the measurement method used, it is between 1 millimeter and 20 meters below the sea surface.
Air masses in the Earth’s atmosphere are significantly altered by sea surface temperatures a short distance from shore. Local areas with heavy snowfall may occur in the windward bands of warm water bodies in an otherwise cold air mass.
Warm sea surface temperatures are known to cause tropical cyclogenesis over the Earth’s oceans. Tropical cyclones can also cause an excellent wake due to turbulent mixing in the upper 30 meters of the sea. SST changes daily, like the weather above it, but to a lesser degree. There is less SST variation on windy days than on calm days.
Climate Change Indicators: Sea Surface Temperature
This indicator explains global trends in sea surface temperature.
Figure 1. Average Global Sea Surface Temperature, 1880–2020
This graph shows how the average surface temperature of the world’s oceans has changed since 1880. This chart uses the 1971 to 2000 average for depicting change.
Choosing a different reference period does not change the shape of the data over time. The shaded band shows the range of uncertainty in the data based on the number of measurements collected and the methods’ precision.
| Year | Annual anomaly | Lower 95% confidence interval | Upper 95% confidence interval |
| 1880 | -0.42 | -0.62815 | -0.21185 |
| 1881 | -0.33 | -0.5311 | -0.1289 |
| 1882 | -0.348 | -0.54557 | -0.15043 |
| 1883 | -0.456 | -0.65004 | -0.26196 |
| 1884 | -0.582 | -0.79015 | -0.37385 |
| 1885 | -0.69 | -0.90168 | -0.47832 |
| 1886 | -0.672 | -0.87662 | -0.46738 |
| 1887 | -0.726 | -0.9024 | -0.5496 |
| 1888 | -0.402 | -0.5537 | -0.2503 |
| 1889 | -0.402 | -0.5537 | -0.2503 |
| 1890 | -0.816 | -0.95359 | -0.67841 |
| 1891 | -0.546 | -0.68712 | -0.40488 |
| 1892 | -0.654 | -0.80218 | -0.50582 |
| 1893 | -0.726 | -0.87418 | -0.57782 |
| 1894 | -0.762 | -0.9137 | -0.6103 |
| 1895 | -0.564 | -0.70865 | -0.41935 |
| 1896 | -0.33 | -0.4817 | -0.1783 |
| 1897 | -0.42 | -0.56818 | -0.27182 |
| 1898 | -0.708 | -0.85265 | -0.56335 |
| 1899 | -0.6 | -0.74465 | -0.45535 |
| 1900 | -0.438 | -0.60029 | -0.27571 |
| 1901 | -0.636 | -0.79123 | -0.48077 |
| 1902 | -0.762 | -0.89606 | -0.62794 |
| 1903 | -1.014 | -1.14806 | -0.87994 |
| 1904 | -1.158 | -1.28854 | -1.02746 |
| 1905 | -0.798 | -0.92148 | -0.67452 |
| 1906 | -0.762 | -0.91018 | -0.61382 |
| 1907 | -0.87 | -1.01112 | -0.72888 |
| 1908 | -1.104 | -1.23806 | -0.96994 |
| 1909 | -1.176 | -1.32065 | -1.03135 |
| 1910 | -1.14 | -1.29876 | -0.98124 |
| 1911 | -1.122 | -1.28782 | -0.95618 |
| 1912 | -0.87 | -1.0464 | -0.6936 |
| 1913 | -0.942 | -1.13251 | -0.75149 |
| 1914 | -0.69 | -0.89462 | -0.48538 |
| 1915 | -0.564 | -0.78274 | -0.34526 |
| 1916 | -0.87 | -1.09226 | -0.64774 |
| 1917 | -0.96 | -1.19638 | -0.72362 |
| 1918 | -0.726 | -0.94826 | -0.50374 |
| 1919 | -0.798 | -1.01674 | -0.57926 |
| 1920 | -0.78 | -0.97757 | -0.58243 |
| 1921 | -0.744 | -0.92393 | -0.56407 |
| 1922 | -0.834 | -1.00334 | -0.66466 |
| 1923 | -0.816 | -0.97123 | -0.66077 |
| 1924 | -0.834 | -0.9857 | -0.6823 |
| 1925 | -0.762 | -0.91018 | -0.61382 |
| 1926 | -0.6 | -0.74465 | -0.45535 |
| 1927 | -0.708 | -0.84559 | -0.57041 |
| 1928 | -0.78 | -0.91759 | -0.64241 |
| 1929 | -0.87 | -1.00406 | -0.73594 |
| 1930 | -0.636 | -0.77006 | -0.50194 |
| 1931 | -0.582 | -0.71959 | -0.44441 |
| 1932 | -0.726 | -0.85654 | -0.59546 |
| 1933 | -0.798 | -0.93206 | -0.66394 |
| 1934 | -0.708 | -0.84206 | -0.57394 |
| 1935 | -0.708 | -0.84206 | -0.57394 |
| 1936 | -0.636 | -0.76654 | -0.50546 |
| 1937 | -0.474 | -0.60101 | -0.34699 |
| 1938 | -0.6 | -0.73759 | -0.46241 |
| 1939 | -0.492 | -0.65782 | -0.32618 |
| 1940 | -0.15 | -0.36874 | 0.068736 |
| 1941 | 0.084 | -0.1806 | 0.3486 |
| 1942 | -0.258 | -0.46968 | -0.04632 |
| 1943 | -0.294 | -0.48098 | -0.10702 |
| 1944 | 0.012 | -0.18557 | 0.209568 |
| 1945 | -0.024 | -0.20393 | 0.155928 |
| 1946 | -0.492 | -0.60842 | -0.37558 |
| 1947 | -0.546 | -0.64831 | -0.44369 |
| 1948 | -0.618 | -0.71678 | -0.51922 |
| 1949 | -0.564 | -0.6522 | -0.4758 |
| 1950 | -0.564 | -0.64514 | -0.48286 |
| 1951 | -0.42 | -0.5082 | -0.3318 |
| 1952 | -0.312 | -0.41431 | -0.20969 |
| 1953 | -0.312 | -0.41784 | -0.20616 |
| 1954 | -0.6 | -0.68467 | -0.51533 |
| 1955 | -0.636 | -0.72773 | -0.54427 |
| 1956 | -0.564 | -0.65926 | -0.46874 |
| 1957 | -0.222 | -0.32431 | -0.11969 |
| 1958 | -0.204 | -0.30278 | -0.10522 |
| 1959 | -0.294 | -0.39984 | -0.18816 |
| 1960 | -0.312 | -0.43548 | -0.18852 |
| 1961 | -0.276 | -0.38537 | -0.16663 |
| 1962 | -0.294 | -0.38573 | -0.20227 |
| 1963 | -0.276 | -0.37478 | -0.17722 |
| 1964 | -0.546 | -0.64126 | -0.45074 |
| 1965 | -0.474 | -0.57984 | -0.36816 |
| 1966 | -0.384 | -0.50395 | -0.26405 |
| 1967 | -0.42 | -0.54348 | -0.29652 |
| 1968 | -0.384 | -0.50748 | -0.26052 |
| 1969 | -0.096 | -0.24065 | 0.048648 |
| 1970 | -0.294 | -0.42101 | -0.16699 |
| 1971 | -0.51 | -0.62995 | -0.39005 |
| 1972 | -0.186 | -0.30948 | -0.06252 |
| 1973 | -0.15 | -0.26642 | -0.03358 |
| 1974 | -0.42 | -0.51878 | -0.32122 |
| 1975 | -0.438 | -0.52267 | -0.35333 |
| 1976 | -0.366 | -0.44714 | -0.28486 |
| 1977 | -0.078 | -0.1662 | 0.0102 |
| 1978 | -0.186 | -0.27067 | -0.10133 |
| 1979 | 0.048 | -0.03667 | 0.132672 |
| 1980 | 0.066 | -0.0222 | 0.1542 |
| 1981 | -0.006 | -0.10126 | 0.089256 |
| 1982 | -0.006 | -0.10126 | 0.089256 |
| 1983 | 0.138 | 0.039216 | 0.236784 |
| 1984 | -0.042 | -0.11609 | 0.032088 |
| 1985 | -0.114 | -0.1775 | -0.0505 |
| 1986 | -0.042 | -0.08786 | 0.003864 |
| 1987 | 0.21 | 0.160608 | 0.259392 |
| 1988 | 0.138 | 0.081552 | 0.194448 |
| 1989 | 0.066 | 0.020136 | 0.111864 |
| 1990 | 0.246 | 0.19308 | 0.29892 |
| 1991 | 0.192 | 0.142608 | 0.241392 |
| 1992 | 0.048 | -0.01198 | 0.107976 |
| 1993 | 0.048 | -0.0155 | 0.111504 |
| 1994 | 0.084 | 0.041664 | 0.126336 |
| 1995 | 0.174 | 0.131664 | 0.216336 |
| 1996 | 0.084 | 0.041664 | 0.126336 |
| 1997 | 0.354 | 0.294024 | 0.413976 |
| 1998 | 0.444 | 0.39108 | 0.49692 |
| 1999 | 0.084 | 0.034608 | 0.133392 |
| 2000 | 0.12 | 0.06708 | 0.17292 |
| 2001 | 0.354 | 0.30108 | 0.40692 |
| 2002 | 0.408 | 0.340968 | 0.475032 |
| 2003 | 0.462 | 0.412608 | 0.511392 |
| 2004 | 0.426 | 0.37308 | 0.47892 |
| 2005 | 0.426 | 0.39072 | 0.46128 |
| 2006 | 0.426 | 0.394248 | 0.457752 |
| 2007 | 0.3 | 0.268248 | 0.331752 |
| 2008 | 0.264 | 0.232248 | 0.295752 |
| 2009 | 0.498 | 0.46272 | 0.53328 |
| 2010 | 0.516 | 0.48072 | 0.55128 |
| 2011 | 0.318 | 0.28272 | 0.35328 |
| 2012 | 0.444 | 0.40872 | 0.47928 |
| 2013 | 0.48 | 0.441192 | 0.518808 |
| 2014 | 0.642 | 0.60672 | 0.67728 |
| 2015 | 0.858 | 0.819192 | 0.896808 |
| 2016 | 0.93 | 0.891192 | 0.968808 |
| 2017 | 0.822 | 0.779664 | 0.864336 |
| 2018 | 0.732 | 0.686136 | 0.777864 |
| 2019 | 0.876 | 0.819552 | 0.932448 |
| 2020 | 0.84 | 0.797664 | 0.882336 |
Figure 1. Average Global Sea Surface Temperature, 1880-2020
Data source: NOAA, 2021
Web update: April 2021
Units: temperature anomaly (°F)
Figure 2. Change in Sea Surface Temperature, 1901–2020
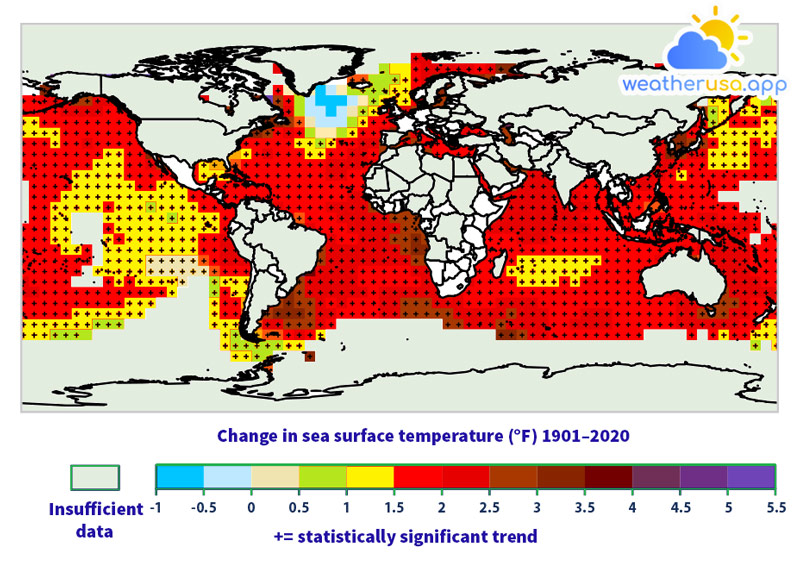
This map shows how the world’s average sea surface temperature changed between 1901 and 2020. It is based on a combination of direct measurements and satellite measurements.
A black “+” icon in the middle of a square on the map means that the trend shown is statistically significant. White areas did not have sufficient data to calculate reliable long-term trends.
Key Points
- Sea surface temperature increased in the 20th century and continues to rise. From 1901 to 2020, the temperature increased by an average of 0.14°F per decade (see Figure 1).
- Sea surface temperature has been higher than ever in the three decades since reliable observations began in 1880 (see Figure 1).
- Based on the historical record, increases in sea surface temperature occurred primarily during two significant periods: between 1910 and 1940 and from 1970 to the present.
Sea surface temperature appears to have cooled between 1880 and 1910 (see Figure 1). - Changes in sea surface temperature vary regionally. While most of the world’s oceans have seen an increase in temperature, a few areas have experienced cooling, such as parts of the North Atlantic (see Figure 2).
Background
- Sea surface temperature—the water at the ocean surface—is an important physical property of the world’s oceans.
The surface temperature of the world’s oceans varies with latitude; the warmest waters are usually near the equator, and the coldest waters are in the Arctic and Antarctic regions.
As the oceans absorb more heat, the sea surface temperature rises, and the ocean circulation patterns that carry warm and cold water worldwide change.
- Changes in sea surface temperature can alter marine ecosystems in many ways. For example, changes in ocean temperature can affect which plant, animal, and microbe species are found in an area, change migration and reproduction patterns, threaten sensitive ocean life such as corals, and change the frequency and intensity of harmful algal blooms “red tide.”
In the long run, increases in sea surface temperature may also reduce circulation patterns that transport nutrients from the deep sea to surface waters.
Changes in reef habitat and food supply can dramatically alter ocean ecosystems and reduce fish populations, affecting people who depend on fishing for food or work.
- Sea surface temperature can also profoundly affect the global climate, as the oceans constantly interact with the atmosphere. Increases in sea surface temperature have increased the amount of atmospheric water vapor over the oceans.
This water vapor feeds precipitation-producing weather systems, increasing the risk of heavy rain and snow. Changes in sea surface temperature can alter storm paths, potentially contributing to drought in some areas.
About the Indicator
This indicator tracks the average global sea surface temperature from 1880 to 2020. It also includes a map showing how the sea surface temperature has changed in the world’s oceans since 1901.
Techniques for measuring sea surface temperature have evolved since the 1800s. For example, the earliest data were collected by inserting a thermometer into a sample of water collected by lowering a bucket from a ship. Today, temperature measurements are collected more systematically from fixed and drifting buoys and ships.
Data show anomalies or differences compared to the mean sea surface temperature from 1971 to 2000. The Intergovernmental Panel initially developed the map in Figure 2 on Climate Change, which calculated long-term trends based on published studies.
About the Data
Indicator Notes
Previous trends shown by this indicator are less detailed due to lower sampling frequency and less specific sampling methods.
Data Sources
Figure 2 is an updated version of a map from the Intergovernmental Panel on Climate Change’s Fifth Assessment Report, which collects data from several studies that provide the best information on climate change.

Weather 01852 - Lowell MA

71°
clear sky
Feels like 70°05:31/19:51
75°F
/66°F
45%
1007 hPa
7 mi
1.99 mph


