Water in the atmosphere
Water in the atmosphere
Evaporation of water
Source of water vapor in the atmosphere. Water in the atmosphere can be seen in 3 states the invisible vapor state, which is characteristic of the humidity in the air; the liquid form, as rain, cloud, and mist; and the solid state, as snow, hail, ice crystals of clouds, and blindness.
The essence of evaporation
- Water molecules are always in a chaotic state of motion. Faster-moving particles can exit the water surface and enter the atmosphere.
At the same time, some water vapor molecules on the surface of the water can return to the water. The more water molecules return from the evaporating surface to the atmosphere, and the fewer water vapor molecules return, the stronger the evaporation process.
Or it is called evaporation. When the amount of water vapor molecules entering the atmosphere equals the amount of producing water vapor, evaporation stops, or the air is saturated with water vapor.
- The main factor determining the intensity of evaporation is the temperature of the evaporating surface, Plus wind speed.
The higher the temperature of the evaporation surface, the stronger the evaporation density, and vice versa. The higher the wind speed, the higher the evaporation density of steam power.
Steam strength
- One of the main factors affecting evaporation density is the amount of water vapor in the air gas at the evaporation surface.
We know from Dan-ton’s law that the pressure of a chemically unrelated gas mixture is equal to the sum of the pressures of each gas component. The atmosphere is a collection of gases, including water vapor.
Air pressure is the sum of the pressures of gases and vapors. The specific pressure of water vapor in the air is called the vapor pressure, and the symbol e: its unit is milli-li-bar or millimeter of mercury; In the SI system – in pascals.
- Newtons evenly distributed over an area of 1m; 1pa= 0.01mb
- The limit value of water vapor swelling at a given air temperature is called saturated vapor swelling, symbol E.
Saturated steam swells at different temperatures. For example, t air is +25°C, the air will be saturated if E = 32 millibars, and when t = 0, then E = 6 mb, and if t = -30°C, then E =. 0.5mb.
- Air does not easily reach saturation with water vapor because the vapor swelling strength is usually minimal compared to the saturated vapor swelling strength.
The greater the loss of saturation, the drier the air and the stronger the evaporation.
Air humidity
Absolute humidity – the mass of water vapor (kg) per unit volume (kg) of air when wet: symbol a (kg/m³).
α – coefficient of thermal expansion of gas, equal to 1/273 = 0,00366
Where: p – air pressure, Mb or pa, e – vapor swelling, Mb or pa.
- We see that the relative humidity can be very large or very small. It does not depend on absolute humidity. In warm regions, the amount of water vapor in the air is much higher than in cold areas.
Still, due to the high temperature, a large amount of water vapor is required for saturation, and therefore the relative humidity is usually low.
There is always a low absolute humidity in cold air, but a small amount of water vapor is required to saturate the air due to the low temperature so that the relative humidity will be high.
- A certain amount of water vapor is sufficient to saturate the air, plus the lower the temperature, the lower the amount of water vapor required to saturate.
If air containing water vapor begins to cool at a specific temperature, the air is saturated with water vapor, and as the cooling continues, the excess condenses and freezes.
The temperature at which water vapor in the atmosphere reaches saturation is called the dew point and is usually denoted by a Greek letter.
- In practice, the dew point is determined by a special degree. In saturated air, the dew point coincides with the air temperature. In all other cases, it is lower than the air temperature and depends on e vapor swelling.
For example, at t = 15°C and e = 12 Mb at τ= 9,7°, this means that the air must cool t-τ =5,3° further to become saturated. But if at the same time t = 15°C and e = 2.0mb, τ = – 12°,6, so 27°,6C more cooling is required to saturate the air.
- Each vapor swelling value is equivalent to the specified absolute humidity, specific humidity, and dew point values. For example, here are some numerical equivalents between a, q, τ, and e.
τ(in °C) …… -30 -10 0 10 20 30
- Until now, the most used methods are the evaporation method and the desiccant method.
The evaporation method measures the humidity in the air according to the cooling of an object when evaporation occurs from its surface. - The basic principle of the evaporation method is how to measure an evaporating object’s temperature with the air’s temperature under normal conditions.
- The stronger it is, the drier the air will be the readings of the two thermometers will be equal only if there is no air vapor saturation and evaporation.
The desiccant method is based on the hydrophilicity of some object or substance. Their shape changes as the amount of water vapor in the air that penetrates them changes. -
The hygroscopic formula calculates the vapor swelling based on the wet and dry thermometer readings: e=E’-0.000662(t-t’)p.
In which E’- storm steam power mix at the temperature of the wet thermometer t;
t- The temperature of the dry thermometer
0.000662 – Humidity constant of moist diameter vaporize
p- Measured air pressure. -
In practical meteorology, people use unique humidity to determine the required humidity levels. The central part of these tables is the measured values t, t’, and p from the available pairs of numbers where we find the water vapor swelling e, the relative humidity f, the saturation loss d, and the dew point temperature.
- According to the sub-tables after the main table, the barometric pressure p is used to correct the saturated vapor swelling E’ at that temperature and t in terms of the dew point τ.
- The order in which the quantities are determined is detailed in the first chapter of the “Moisture Chart” book.
Here are a few simple examples
Example 1: Dry thermometer measurement t = 6°.8 C of wet thermometer t’ = 4°,2 measured barometric pressure P = 851,5 mb; find τ, e, and f?
- Look at the humidity with t=6°.8C in the top row from table 1 on page 32 of the book. In the same column with the value t’ = 4°,2C, we find e = 6,17 and f =62% τ = 0°.7C.
Example 2: t = 24°.7 C; t’ = 22°.4C, p = 1020, 2mb
Find e f and τ. -
From table 1 on page 78, we look for t’ = 22°.4C in that column with the value t = 24°.7 C horizontally and find τ= 21°2, e = 25,2, and f = 81%.
- Air humidity measuring tools
-
Instruments for measuring air humidity evaporative hygrometer. An evaporative hygrometer is used to measure the air’s moisture by the evaporation method. Evaporative hygrometers are divided into fixed type and portable type.
-
The static evaporative hygrometer is often found in a fixed location at weather stations, even on ships.
The main components include two identical thermometers located vertically parallel to each other, the bulb of one of the two thermometers inserted into a glass of water – the so-called wet thermometer, still hot. The other is a dry thermometer. -
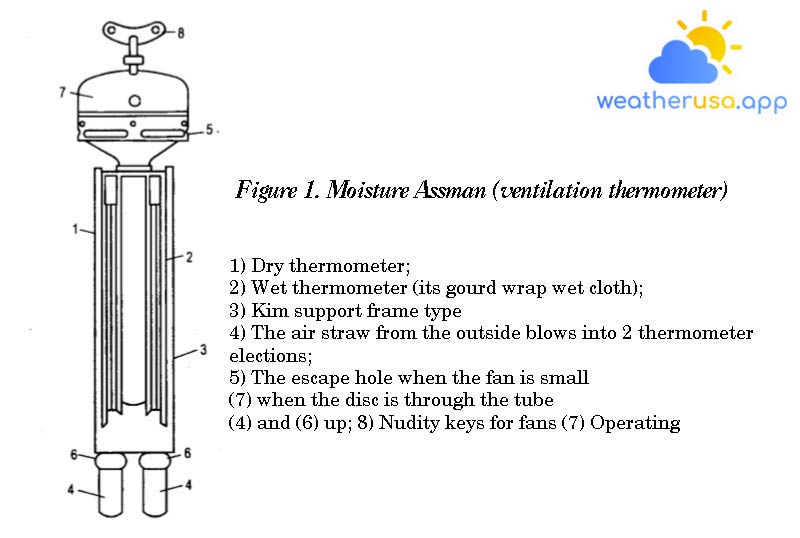
Portable evaporative hygrometer, also known as Assman hygrometer or ventilation hygrometer. This device is very suitable for measuring local air humidity in different areas.
The central part of the Assman hygrometer consists of two identical thermometers placed in a metal frame, one of the two thermometers wrapped in a wet cloth is called a damp thermometer.
The top of the hygrometer is equipped with a small fan for ventilation if a mainspring is wound. Air from the outside is sucked into the two pipes, blown through the wet and dry bulb bulbs, and blown up the pipe and out through the hole.
In the process of blowing air from the wet bulb, the thermometer will cause the mercury column to fall by the evaporation of the damp cloth wrapped around the mercury bulb.
The drier the air, the stronger the evaporation, the lower the temperature of the wet bulb, and vice versa. Thus, the relative humidity of the air is calculated by measuring the temperature of two damp and dry thermometers. The calculation to find f,e requires a “humidity table.” -
The hair hygrometer is advantageously used in stationary conditions. The working principle of this hygrometer is based on the change in the length of the human hair according to the change in humidity in the air.
When the humidity change causes the bristle length to change, this change causes the index needle to point to the moisture divider ring. All vehicle details are placed on a wooden stand. - Self-recording hygrometer, also known as a hygrometer, is used to record the continuous process of air humidity. The structure of the hygrometer consists of two main parts: the sensing and recording parts. The recorder is the same as the thermometer.
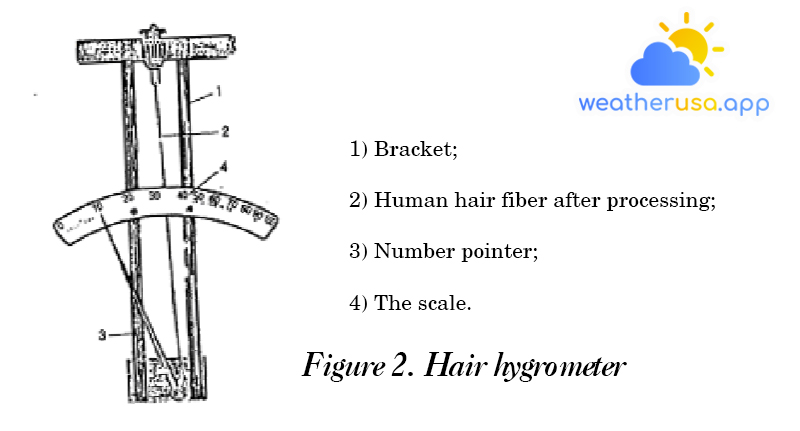
Figure 2. Hair hygrometer
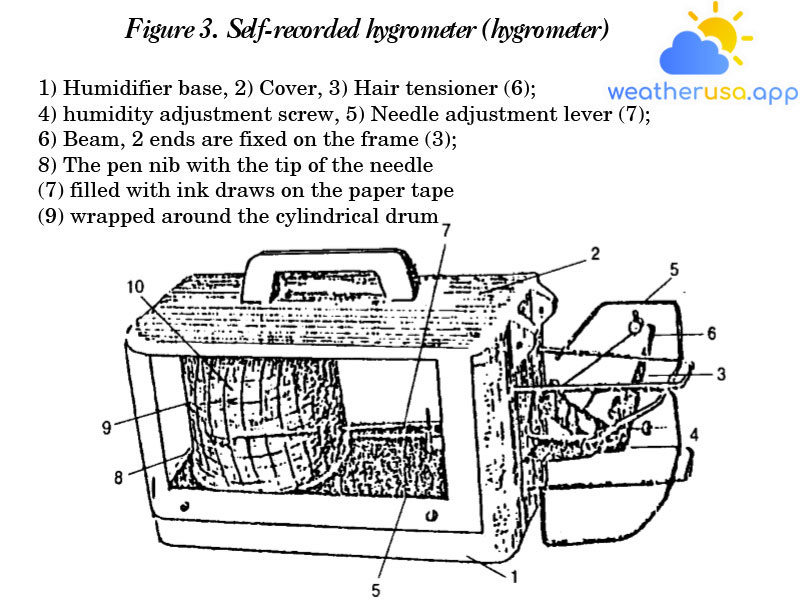
Figure 3. Self-recorded hygrometer (hygrometer)
The phase change of water in the atmosphere
Dry adiabatic process
- In most cases, the water vapor entering the atmosphere is not entirely above the evaporating surface.
It is blown in the horizontal direction due to the movement of the wind, and at the same time, there is a higher shift in the troposphere. - During the rise of a given air mass, the volume of the gas will expand due to the decrease in pressure with altitude, and it will cool down because the heat has to be spent for growth Expansion.
When descending, the reverse process occurs – the air is compressed and heated. When the air mass temperature does not reach the dew point, it gets colder by about 1° every 100 m it is raised, i.e., equal to the amount of vertical thermal gradient γk process; the rise or fall of unsaturated air is called the dry adiabatic process. - For saturated air, the process is called moist adiabatic γa denotes the moist adiabatic gradient. Unlike the dry adiabatic slope (γk), the wet adiabatic pitch is not constant but varies in the range of 0°3 to 0°9 at 100 m altitude according to temperature and barometric pressure.
The most characteristic amount for summer humid adiabatic processes in the lower layers of the atmosphere is γa = 0°4 – 0°5. In winter, it is 0°7 – 0°9 at an altitude of 100 m but reaches a height of about 7-9 km 1°/100 m.
Condensation and Freezing -
Condensation is the transition of moisture in the air from vapor to liquid, that is, water droplets. In the same process, freezing can occur – the evolution of humidity in the air from steam to solid, ignoring liquid, in the form of ice crystals.
-
A prerequisite for the onset of condensation or freezing of water vapor in saturated air is the need to lower the air temperature.
-
In nature, a decrease in air temperature can occur when: The vertical movement of air leads to a moist adiabatic cooling process.
-
The movement of warm and humid air to the colder bottom. Strong heat dissipation of air by longwave radiation, mostly on land, on clear cloudy nights.
-
The second condition necessary for initiating accumulation is the presence of a so-called particle agglutinating agent in the air.
- The components that can form agglomerated nuclei are solid particles suspended in the atmosphere: dust particles, sand, grit, and salt molecules…
- Not only does the water in the atmosphere change from a vapor state to a liquid or solid state, but also reverse processes occur.
Products start to evaporate due to condensation and freezing due to thermal radiation at night, and turn into daytime due to the heating of the sun and return to the form of water vapor.
However, most moisture that passes from the water vapor to the liquid or solid state falls to the earth as rain, snow, or hail.
Fog
- Fog and smoke
Fog is a collection of tiny water droplets or tiny ice crystals in a layer of gas near the ground. Visibility in fog is significantly reduced. I
f the number of small water droplets or ice crystals is not too large, the event is called smoke unless the vision-impairing event is too large. The color of the air is silvery when there is smoke. - The process of formation of fog
For one reason or another, the ultimate prerequisite is lowering the air temperature below the dew point.
Fog formation is the process of reducing the temperature of hot and humid air to the dew point (τ). From this point of view, we see three leading causes: the cold spreading at night and in the early morning, during clear skies, but mostly on land; hot movement of moist air to the more excellent bed surface; or evaporation of water from its texture is more desirable than the surrounding air.
Besides the reasons mentioned earlier, an indispensable condition is the presence of condensation nuclei in the air and high air humidity. Fog formation begins when the relative humidity approaches 100%.
Fog classification: According to the formation conditions, people are divided into three types of fog: radiation blindness, stratospheric blindness, and evaporation blindness. An indispensable condition is the presence of condensation nuclei in the air and high air humidity. - Fog classification
- According to the formation conditions, people are divided into three types of fog: radiation blindness, stratospheric blindness, and evaporation blindness;
- Land-specific radiation blindness usually occurs at night and in the early morning during periods of low cloud cover. The density of such curtains is low. Blue can be seen, especially in the vertical direction.
Radiation blindness usually occurs slightly lower than the surrounding ground and only develops at an altitude of 1 – 2 m. - Radiation blindness is usually short-lived. It is newly formed at night, then dispersed into the air on average with increased air temperature since sunrise. But in winter, in some places, this type of blindness persists for days in a row.
-
Sedimentary blindness is expected in the seas and oceans and on coastal roads. Unlike radiation blindness, this type has high stability, sizeable vertical thickness, and general area and is seen when wind speed is less than 10m/s.
This type of blindness significantly reduces vision. Near the coast, stratospheric blinding occurs when air from warmer, more humid seas slowly moves over cold soils and is usually seen in the fall and winter. -
In contrast, off the southwest coast of Africa and the coast of South America, there is fog over the cold Begin and Peruvian currents due to the movement of warm and moist air from the incoming continents.
Sedimentary fog is shared, where warm and cold ocean currents flow close together or mix. As in the Atlantic, the blind zone is most concentrated near Niufaundlan, where the cold Labrador Current meets the Warm Gulfstream.
Fog forms here for up to 80 days each year, which is most common in the hot season. The most common places of intense blindness are the waters of the Scandinavian countries of the Atlantic Ocean, such as England, Germany, the Dutch coast, south of Skandinov, and Laman Bay. -
In the northern part of the Pacific, the highest fog frequency is in the Kuroxio warm currents and the cold Bering waters, the Sea of Okhotsk and the Gulf of Alaska, and the North Pacific.
As in the North Atlantic, there is more fog in the warm season than in winter. A similar annual variation in fog frequency in the Arctic oceanic seas is 40% lower than the total number of foggy days in the entire year in the observed summer months.
In the southern hemisphere, fog frequency is most common in the 40 – 60°S latitude zone. While the highest frequency is 30% in January, the frequency drops to 10-20% in July and August. - Evaporative fog or marine evaporation occurs in seas that are not too cold in winter or bodies of water in the middle of icy seas; when a freezing air stream reaches the relatively warmer sea surface.
Water vapor from the warm sea surface enters the air and encounters a stream of air too cold to condense and form fog. The density of the evaporation curtain is not high. It reduces visibility very much.
Effect of fog on radar image quality
Fog is one of the meteorological phenomena that reduces the radar target detection range. The degree of attenuation of the signal on the radar screen in fog depends on the density of the mist, the air temperature, and the length at which the signal penetrates the blind.
When the distance in the blind is 30-50 m, the radar’s range drops to about 30-45% if the wavelength is 3.2 cm and about 10-15% at 10 cm. The signal attenuation is minimal when the visibility is 50-80 m.
When the distance is above 80 m, the radar range practically does not change. At low temperatures, the attenuation of the radar signal in fog is more vital than at high temperatures of the atmosphere.
Therefore, long-range radar attenuation in blinding is greatest in the polar regions.
Cloudy
What are clouds?
Clouds are condensation products of water vapor, differing from fog only in that clouds form at high altitudes.
Causes of cloud formation: mainly due to the upward movement of air leading to its adiabatic cooling.
Depending on the structure, clouds can be divided into three types:
I- It consists only of water droplets. Water drops may not freeze at temperatures down to -15°, sometimes even lower. In summer, in middle latitudes, such clouds are formed at altitudes of up to 5-6 km.
II- Mixed structure of freezing water droplets and ice crystals, these clouds are usually encountered at temperatures between -10° and -30°. They are found in the middle latitudes at an altitude of 5-8 km in the warm season.
III- Cloud structure consisting entirely of ice crystals and usually found at altitudes above 8 km.
In winter, mixed and crystalline clouds are located near the ground.
The size of water droplets in clouds is almost the same as in fog, slightly smaller because their weight cannot exceed the resistance of the air, and the droplets can fly freely in any direction of air movement.
Clouds are classified according to their water content in terms of the amount of liquid and solid water in the shadows. In droplet clouds, the water level is between 0.2 and 5 grams per transparent cloud. In crystal clouds, the water content is much less – from 1/100 to 1/1000 grams per 1 m3.
Spend away. Heavy cumulus clouds or dense low-level clouds significantly reduce illumination and worsen the prediction.
Cloud form
There are many rich and diverse cloud shapes based on the cause of their formation, but in general, they can be divided into three main types: cumulus clouds, layered clouds, and wave clouds.
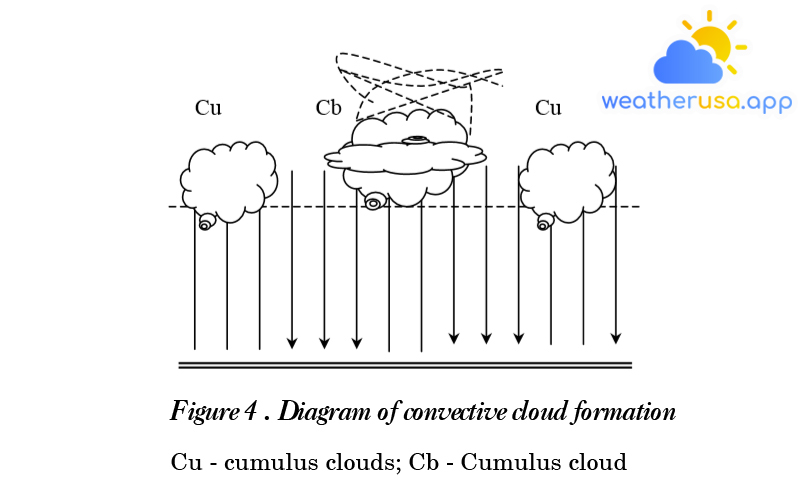
Cumulus clouds form due to the vertical movement of air in convection; this occurs when the pillow is unevenly heated by sunlight, resulting in convection homogeneity.
More critical, burned areas will be hotter and lighter air will move upwards. And less burned in the field – creating downward air currents. Upstream, when the agglomeration ink is reached.
It starts to form clouds by condensing the water vapor. The continued growth of shadows depends on the temperature distribution characteristics of the surrounding air. If the state of the atmosphere is not stable, the temperature of the surrounding air drops sharply with altitude.
Cumulus clouds can grow to a height of 8-10 km, or even up to 13 km. in mid-latitudes and up to 15-16 km – in the tropics, it turns into cumulonimbus and dense storm clouds.
If the temperature in the atmosphere slows down with altitude, significantly above the agglomeration level, an inversion layer forms. Even at low heights, continued altitude growth has already taken place stopped.
This creates cumulus clouds. Due to mid-latitude convection, cumulus clouds usually only appear during the year’s warm season. On land, they appear in the morning and disperse in the afternoon.
On the contrary, they appear in the seas close to shore at night. In the tropics, convective clouds can occur at any time of the year and above the sea – at any time of the day.

Cumulus clouds are not just the result of convection. When the colder air, denser and heavier, is accelerated towards the warm air for some reason, it causes the warm air to rise.
In this case, an area of thick cumulus clouds or thunderstorms appears at the contact line of cold air, called the cold front. This process is specific to middle and subtropical latitudes and can occur at any time of the year and any time of the day. Thunderstorms occur at sea and on land near the coast, even in winter.
The equatorial region often develops thick cumulus clouds where the air currents of the northern and southern hemispheres meet. There are also air masses with the same temperature.
For different reasons, they merge in an area with a strong updraft that increases the convection current. This region, called the intratropical convergence zone, is where cumulus clouds grow steadily.
Layered clouds are divided into two types according to the conditions of their regeneration: layer clouds formed in a homogeneous air mass, and fire clouds formed at the boundary of two air masses with different temperatures.
The radiative cooling of moist air forms layer clouds in degrees above the ground. They are characteristic of middle and high latitudes – in winter and autumn, they constantly hold for days and do not disperse.
In summer, it usually occurs in the morning, when the heat radiation reaches its maximum value at night and dissipates at noon.
Front clouds form when two hot and cold masses come together, and the warmer air mass slides upward at the interface. Meanwhile, the vertical velocity of the lifted hot gas is minimal, but its group is infinitely large.
The moist adiabatic cooling of these dense gas layers leads to condensing of large quantities of water vapor. The result is a vast cloud system stretching thousands of kilometers along the front, hundreds of kilometers wide, and the densest central part – several kilometers, sometimes 8-10 km.
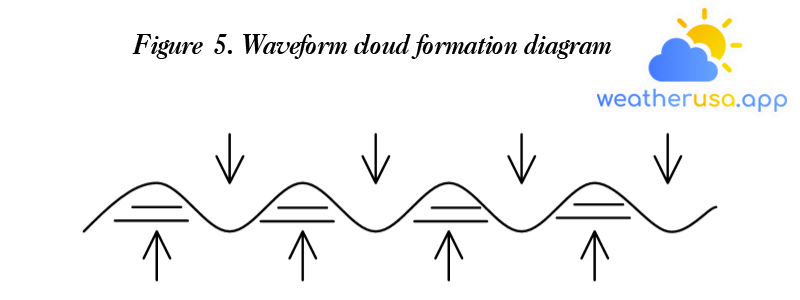
A system of bulky clouds – lower layer, middle clouds – stratosphere, and upper clouds or higher Waveform clouds are produced under the reverse layer when there is a marked difference in wind speed at the top and bottom. Then the reverse layer appears like ocean waves when the wind blows.
The moist air ascending the wave crest is cooled adiabatically so that condensation and cloud formation occurs at the spines, and warmer air descends between the waves.
The clouds dissipate, or there is such a thick reduction that the sky begins to spin brightness. As a result, the cloud layer splits into separate troughs distributed parallel to the wave crests. The vertical thickness of the waveform cloud is not significant.
Waveform clouds can be seen at any height in the troposphere. Depending on the peak, they are called stratocumulus, mesocumulus, and calculus clouds. Wavelength can range from 50 to 2000 km.
Waveform clouds can be seen at any height in the troposphere. Depending on the altitude, they have named stratocumulus (under 2 km), mesocumulus (from 2 to 6 km), and ciculus clouds (over 6 km).
International classification of rattan
Cloud classification is based on the outer shape and height of the clouds. The global rattan ranking includes ten main grades and two subclasses.
In practical meteorology, to accurately describe cloud form, it is necessary to rely on pictures of the most common shape of clouds collected in “Atlac clouds.”
Below are summaries of the leading cloud types with their family distributions – sub-cloud family, vertically growing cloud family, mid clouds family, and upper-cloud family.
- Low-level cloud family.
Cucumulus cloud, Latin Stratocumulus, Sc symbol. It is usually a layered gray thick veil with dark clouds parallel to the light streaks between them if dispersed at low altitudes. Layer cloud – thick cumulus.
At a more than 0.6 km length, layer cloud – bright cumulus. They are large plates of gray, often scaly, clearly showing a blue tint between them. These are water clouds.
Layer cloud, Latin Stratus, symbol St, usually irregular shape, uniform color of the mantle located below the sea surface or near land.
Cloudy-layer, Latin Nimbostratus, symbol Ns, looks like a layer cloud but is darker in color. They usually give water, but sometimes rain small particles do not reach the ground. From cloud clouds – layers, according to the principle, produced dancing cloud fragments.
- The rattan family grows upright.
Cumulus, Latin Cumulus, symbol Cu, have a distinctive block form with glossy white tops, gray legs, and blue in between. The cloud base is not very high, but the top of the cumulus is 3-4 km thick and dome-shaped.
Cloudy – Tich, abbreviated from Latin Cumulonimbus, Cb. Unlike thick cumulus clouds, the top of cumulonimbus clouds can reach the topmost layer of the troposphere, appearing as many large mountains filled with bright white peaks and dark cloud bases.
Because the top of the cloud is so high and its temperature is so low, its composition consists only of ice crystals and is usually dispersed by the wind from the top of the cloud, forming an anvil.
The middle part of the cumulus cloud is a mixture of ice crystals and icy water droplets.Cumulus clouds are developed or thunderstorms, sometimes in the form of hail. Winter – heavy snowfall. Just before it rained, snow or strong winds began to fall.
- Medium cloud family.
Central cloud – cumulus, Latin Altocumulus, symbol Ac. The appearance is similar to a thin cumulus cloud but lighter in color, with a small dark line near the center of the plates, the size of which is much smaller than that of a thin cumulus cloud.
Medium cumulative clouds also have thick types that often appear with medium clouds. In mid-latitudes, it is difficult to determine the elevation of mountains in the range of 2 – 6 km. The composition of the clouds consists mainly of tiny water droplets that are very cold.
Middle cloud layer, Latin Altostratus, as a symbol. It is a smooth white, white-gray, or gray coat. The sun or moon can be seen dimly through the thin layer of cloud in the middle.
The average cloud height over mid-latitudes is about 3-5 km. This cloud comprises freezing water droplets or a mixture of water and ice crystals. USA In summer sometimes the water does not reach the ground, in winter it can snow a little.They darken the upper floor.
Cirrus, Latin Cirrus, symbol Ci, average height 7-10 km, thin white thread, often in a ponytail, hook-shaped. This cloud is derived from cumulus anvils, which have no definite shape.
Cirrus, Latin Cirrocumulus, symbol Cc, average height 6-8 km. They are shaped like small white flakes or ripples, consisting of small fluffy white tufts, and often appear with cirrus clouds.
Cirrus, the Latin symbol Cirrostratus Cs with an average height of 6-8 km. is a uniform, transparent white. Through it, you can see the sun, the moon, and the shadows on the ground.
When this cloud is around the sun, the moon forms a fairly sizeable colored circle called a halo. All the upper layers are made up of ice crystals.
How to observe clouds
Observations of clouds on board ships are crucial not only for meteorological agencies but also for mariners since, in many cases, they allow navigation based on weather forecasts.
The cloud observation program includes cloud classification, amount of available clouds, amount of low and vertical clouds, and visual estimation of cloud base height clouds; to correctly identify the type of cloud, it is necessary to use a specialized Atlas rattan.
The total amount of cloud is estimated visually based on the extent of cloud cover in the sky. This rating is expressed in tenths or eighths of the complete sky coverage by cloud type or converted to cloud quality.
A cloud level corresponds to 10% of the sky surface, so if the whole sky is covered with clouds, the total amount of clouds is evaluated as level 10. If the clouds cover 80% of the sky, the level of cloud is 8.
Suppose the area of cloud cover and the remaining sky area (the part of blue sky) are roughly equal. In that case, the cloud level is 5 … when determining the amount of cloud, the overall amount must be evaluated first (symbol). N)-
Table 1
| Cloud class | Symbol |
The average height of cloud base at mid-latitudes (km) |
|
| Name in English | Latin | ||
|
Low-level cloud family (lower than 2 km at the base of the cloud) |
|||
| Clouds – cumulus | Stratocumulus | Sc | 0. 3 – 1.5 |
| Clouds | Stratus | St | 0.05 – 0.5 |
| Dance – floor | Nimbostratus | Ns | 0.1 1.0 |
|
The rattan family grows vertically (the height of the cloud base is less than 2 km) |
|||
| Cumulus | Cumulus | Cu | 0.3 – 1.5 |
| Cloud dance – cumin | Cumulonimbus | Cb | 0.4 – 1.0 |
| Middle cloud family (height of cloud base 2-6 km) | |||
| Mid-cumulative clouds | Altocumulus | Ac | 2 – 6 |
| Mid-level clouds | Altostratus | As | 3 – 5 |
| Upper cloud family (over 6 km) | |||
| Clouds | Cirrus | Ci | 7 – 10 |
| Clouds – cumulus | Cirrocumulus | Cc | 6 – 8 |
| Clouds – floors | Cirrostratus | Cs | 6 – 8 |
The deck officer records cloud monitoring data in the hydro-meteorological observation log. Of course, surveillance data must be coded in the form of numbers and signs under international conventions.
Table 2. Table of cloud volume in parts 10 and part 8 (okta) and cloud level codes
| Amount of clouds | Code | |
| Section 10 | Section 8 (okta) | |
| Cloudless sky | Cloudless sky | 0 |
| Clouds 1/10 (or less) | 1. Okta or less | 1 |
| Cloud cover 2/10-3/10 | 2. Okta | 2 |
| Cloud cover 4/10 | 3. Okta | 3 |
| Cloud cover 5/10 | 4. Okta | 4 |
| Cloud cover 6/10 | 5. Okta | 5 |
| Cloud cover 7/10 – 8/10 | 6. Okta | 6 |
| Cloud cover 9/10 | 7. Okta | 7 |
| Cloud cover 10/10 | 8. Okta | 8 |
| The weather is terrible, or the number of clouds cannot be estimated | 9 | |
| Can’t monitor | / | |

Weather 01852 - Lowell MA

47°
clear sky
Feels like 47°05:35/19:48
51°F
/44°F
78%
1023 hPa
7 mi
0 mph


