U.S. and Global Temperature
Climate Change Indicators: U.S. and Global Temperature
This indicator describes trends in average surface temperature for the United States and the world.
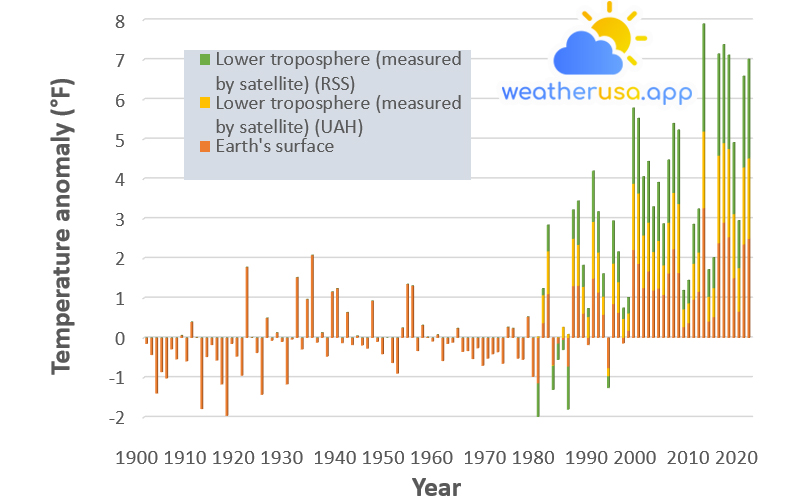
Figure 1. Temperatures in the Contiguous 48 States, 1901–2021

This figure shows how annual average temperatures in the contiguous 48 states have changed since 1901. Surface data come from land-based weather stations. Satellite measurements cover the lower troposphere, the lowest level of the Earth’s atmosphere. “UAH” and “RSS” represent two different methods of analyzing the original satellite measurements. This graph uses the 1901–2000 average as a baseline for depicting change. Choosing another baseline period would not change the shape of the data over time.
| Year | Earth’s surface | Lower troposphere (measured by satellite) (UAH) |
Lower troposphere (measured by satellite) (RSS)
|
| 1901 | -0.15 | null | null |
| 1902 | -0.43 | null | null |
| 1903 | -1.4 | null | null |
| 1904 | -0.86 | null | null |
| 1905 | -1.02 | null | null |
| 1906 | -0.29 | null | null |
| 1907 | -0.54 | null | null |
| 1908 | 0.06 | null | null |
| 1909 | -0.59 | null | null |
| 1910 | 0.4 | null | null |
| 1911 | 0.01 | null | null |
| 1912 | -1.79 | null | null |
| 1913 | -0.48 | null | null |
| 1914 | -0.18 | null | null |
| 1915 | -0.57 | null | null |
| 1916 | -1.17 | null | null |
| 1917 | -1.96 | null | null |
| 1918 | -0.15 | null | null |
| 1919 | -0.47 | null | null |
| 1920 | -0.95 | null | null |
| 1921 | 1.78 | null | null |
| 1922 | 0.01 | null | null |
| 1923 | -0.38 | null | null |
| 1924 | -1.43 | null | null |
| 1925 | 0.5 | null | null |
| 1926 | -0.07 | null | null |
| 1927 | 0.13 | null | null |
| 1928 | -0.1 | null | null |
| 1929 | -1.17 | null | null |
| 1930 | -0.04 | null | null |
| 1931 | 1.52 | null | null |
| 1932 | -0.29 | null | null |
| 1933 | 0.97 | null | null |
| 1934 | 02.08 | null | null |
| 1935 | -0.12 | null | null |
| 1936 | 0.13 | null | null |
| 1937 | -0.47 | null | null |
| 1938 | 1.16 | null | null |
| 1939 | 1.24 | null | null |
| 1940 | -0.13 | null | null |
| 1941 | 0.64 | null | null |
| 1942 | -0.18 | null | null |
| 1943 | 0.05 | null | null |
| 1944 | -0.19 | null | null |
| 1945 | -0.27 | null | null |
| 1946 | 0.93 | null | null |
| 1947 | -0.1 | null | null |
| 1948 | -0.41 | null | null |
| 1949 | 0 | null | null |
| 1950 | -0.63 | null | null |
| 1951 | -0.9 | null | null |
| 1952 | 0.25 | null | null |
| 1953 | 1.35 | null | null |
| 1954 | 1.31 | null | null |
| 1955 | -0.33 | null | null |
| 1956 | 0.32 | null | null |
| 1957 | 0.02 | null | null |
| 1958 | -0.09 | null | null |
| 1959 | 0.08 | null | null |
| 1960 | -0.58 | null | null |
| 1961 | -0.15 | null | null |
| 1962 | -0.12 | null | null |
| 1963 | 0.24 | null | null |
| 1964 | -0.35 | null | null |
| 1965 | -0.33 | null | null |
| 1966 | -0.53 | null | null |
| 1967 | -0.26 | null | null |
| 1968 | -0.7 | null | null |
| 1969 | -0.52 | null | null |
| 1970 | -0.41 | null | null |
| 1971 | -0.36 | null | null |
| 1972 | -0.65 | null | null |
| 1973 | 0.27 | null | null |
| 1974 | 0.24 | null | null |
| 1975 | -0.52 | null | null |
| 1976 | -0.55 | null | null |
| 1977 | 0.53 | null | null |
| 1978 | -0.98 | null | null |
| 1979 | -1.14 | 23.906.977 | -847.286.047 |
| 1980 | 0.37 | 703.406.977 | 165.963.953 |
| 1981 | 1.1 | 1.076.906.977 | 662.613.953 |
| 1982 | -0.68 | -16.593.023 | -610.736.047 |
| 1983 | -0.14 | 5.906.977 | -412.586.047 |
| 1984 | -0.05 | 266.906.977 | -254.936.047 |
| 1985 | -0.72 | 85.406.977 | -1.084.286.047 |
| 1986 | 1.3 | 1.193.906.977 | 726.513.953 |
| 1987 | 1.31 | 1.027.406.977 | 1.106.013.953 |
| 1988 | 0.61 | 670.406.977 | 545.313.953 |
| 1989 | -0.18 | 523.406.977 | 215.163.953 |
| 1990 | 1.49 | 1.427.906.977 | 1.278.363.953 |
| 1991 | 1.14 | 1.006.406.977 | 1.028.313.953 |
| 1992 | 0.58 | 455.906.977 | 574.563.953 |
| 1993 | -0.76 | -202.593.023 | -297.986.047 |
| 1994 | 0.85 | 1.016.906.977 | 1.076.163.953 |
| 1995 | 0.63 | 772.406.977 | 761.913.953 |
| 1996 | -0.14 | 476.906.977 | 273.513.953 |
| 1997 | 0.18 | 431.906.977 | 402.813.953 |
| 1998 | 2.21 | 1.666.406.977 | 1.906.863.953 |
| 1999 | 1.86 | 1.771.406.977 | 1.892.613.953 |
| 2000 | 1.25 | 1.324.406.977 | 1.479.963.953 |
| 2001 | 1.67 | 1.229.906.977 | 1.539.363.953 |
| 2002 | 1.19 | 970.406.977 | 1.137.813.953 |
| 2003 | 1.24 | 1.198.406.977 | 1.472.613.953 |
| 2004 | 01.08 | 742.406.977 | 1.047.813.953 |
| 2005 | 1.62 | 1.276.406.977 | 1.579.713.953 |
| 2006 | 2.23 | 1.415.906.977 | 1.748.463.953 |
| 2007 | 1.63 | 1.736.906.977 | 1.864.563.953 |
| 2008 | 0.27 | 445.406.977 | 478.563.953 |
| 2009 | 0.37 | 497.906.977 | 579.813.953 |
| 2010 | 0.96 | 904.406.977 | 992.913.953 |
| 2011 | 1.16 | 986.906.977 | 1.096.263.953 |
| 2012 | 3.26 | 1.930.406.977 | 2.708.763.953 |
| 2013 | 0.41 | 623.906.977 | 684.213.953 |
| 2014 | 0.52 | 728.906.977 | 770.763.953 |
| 2015 | 2.38 | 2.204.906.977 | 2.559.963.953 |
| 2016 | 2.9 | 1.999.406.977 | 2.479.713.953 |
| 2017 | 2.53 | 2.219.906.977 | 2.365.113.953 |
| 2018 | 1.5 | 1.610.906.977 | 1.803.213.953 |
| 2019 | 0.66 | 1.094.906.977 | 1.197.363.953 |
| 2020 | 2.35 | 1.937.906.977 | 2.297.463.953 |
| 2021 | 2.49 | 2.024.906.977 | 2.496.663.953 |
Data source: NOAA, 2022
Web update: July 2022
Units: °F
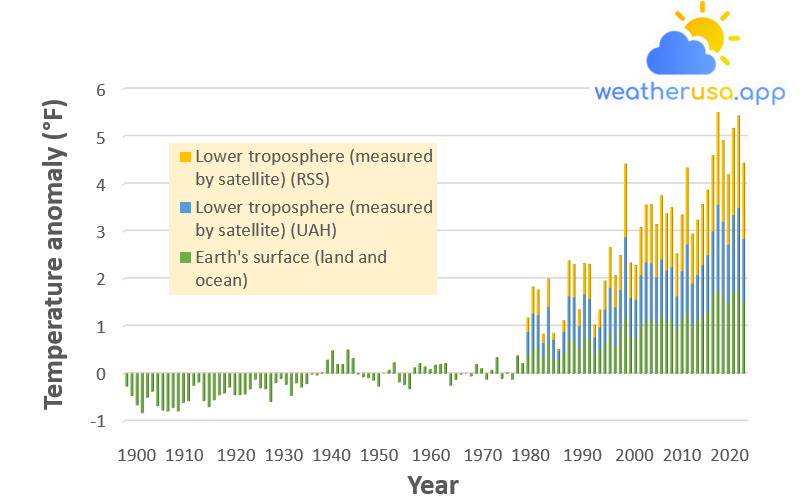
This figure shows how annual average temperatures worldwide have changed since 1901. Surface data come from a combined set of land-based weather stations and sea surface temperature measurements. Satellite measurements cover the lower troposphere, the lowest level of the Earth’s atmosphere. “UAH” and “RSS” represent two different methods of analyzing the original satellite measurements. This graph uses the 1901–2000 average as a baseline for depicting change. Choosing another baseline period would not change the shape of the data over time.
| Year | Earth’s surface (land and ocean) | Lower troposphere (measured by satellite) (UAH) | Lower troposphere (measured by satellite) (RSS) |
| 1901 | -0.27 | null | null |
| 1902 | -0.468 | null | null |
| 1903 | -0.666 | null | null |
| 1904 | -0.828 | null | null |
| 1905 | -0.504 | null | null |
| 1906 | -0.378 | null | null |
| 1907 | -0.684 | null | null |
| 1908 | -0.774 | null | null |
| 1909 | -0.792 | null | null |
| 1910 | -0.72 | null | null |
| 1911 | -0.792 | null | null |
| 1912 | -0.612 | null | null |
| 1913 | -0.576 | null | null |
| 1914 | -0.252 | null | null |
| 1915 | -0.18 | null | null |
| 1916 | -0.576 | null | null |
| 1917 | -0.702 | null | null |
| 1918 | -0.558 | null | null |
| 1919 | -0.45 | null | null |
| 1920 | -0.414 | null | null |
| 1921 | -0.288 | null | null |
| 1922 | -0.45 | null | null |
| 1923 | -0.45 | null | null |
| 1924 | -0.432 | null | null |
| 1925 | -0.324 | null | null |
| 1926 | -0.126 | null | null |
| 1927 | -0.306 | null | null |
| 1928 | -0.324 | null | null |
| 1929 | -0.594 | null | null |
| 1930 | -0.198 | null | null |
| 1931 | -0.108 | null | null |
| 1932 | -0.234 | null | null |
| 1933 | -0.468 | null | null |
| 1934 | -0.198 | null | null |
| 1935 | -0.288 | null | null |
| 1936 | -0.216 | null | null |
| 1937 | -0.018 | null | null |
| 1938 | -0.036 | null | null |
| 1939 | 0.018 | null | null |
| 1940 | 0.288 | null | null |
| 1941 | 0.486 | null | null |
| 1942 | 0.198 | null | null |
| 1943 | 0.198 | null | null |
| 1944 | 0.504 | null | null |
| 1945 | 0.324 | null | null |
| 1946 | -0.018 | null | null |
| 1947 | -0.072 | null | null |
| 1948 | -0.09 | null | null |
| 1949 | -0.144 | null | null |
| 1950 | -0.27 | null | null |
| 1951 | 0 | null | null |
| 1952 | 0.072 | null | null |
| 1953 | 0.234 | null | null |
| 1954 | -0.18 | null | null |
| 1955 | -0.234 | null | null |
| 1956 | -0.324 | null | null |
| 1957 | 0.126 | null | null |
| 1958 | 0.216 | null | null |
| 1959 | 0.144 | null | null |
| 1960 | 0.09 | null | null |
| 1961 | 0.18 | null | null |
| 1962 | 0.198 | null | null |
| 1963 | 0.216 | null | null |
| 1964 | -0.252 | null | null |
| 1965 | -0.126 | null | null |
| 1966 | -0.018 | null | null |
| 1967 | 0 | null | null |
| 1968 | -0.054 | null | null |
| 1969 | 0.198 | null | null |
| 1970 | 0.108 | null | null |
| 1971 | -0.126 | null | null |
| 1972 | 0.072 | null | null |
| 1973 | 0.342 | null | null |
| 1974 | -0.108 | null | null |
| 1975 | 0.018 | null | null |
| 1976 | -0.126 | null | null |
| 1977 | 0.378 | null | null |
| 1978 | 0.216 | null | null |
| 1979 | 0.414 | 0.467581 | 0.292078 |
| 1980 | 0.504 | 0.764581 | 0.556078 |
| 1981 | 0.594 | 0.640081 | 0.531328 |
| 1982 | 0.342 | 0.308581 | 0.184228 |
| 1983 | 0.648 | 0.764581 | 0.581578 |
| 1984 | 0.306 | 0.412081 | 0.127828 |
| 1985 | 0.288 | 0.190081 | 0.034228 |
| 1986 | 0.432 | 0.449581 | 0.235828 |
| 1987 | 0.702 | 0.929581 | 0.747478 |
| 1988 | 0.702 | 0.910081 | 0.691978 |
| 1989 | 0.54 | 0.466081 | 0.342028 |
| 1990 | 0.81 | 0.865081 | 0.645178 |
| 1991 | 0.702 | 0.877081 | 0.725578 |
| 1992 | 0.432 | 0.335581 | 0.255628 |
| 1993 | 0.504 | 0.473581 | 0.364228 |
| 1994 | 0.63 | 0.724081 | 0.599728 |
| 1995 | 0.846 | 0.967081 | 0.842878 |
| 1996 | 0.576 | 0.824581 | 0.669628 |
| 1997 | 0.936 | 0.826081 | 0.729628 |
| 1998 | 1.17 | 1.712581 | 1.535878 |
| 1999 | 0.792 | 0.809581 | 0.731728 |
| 2000 | 0.756 | 0.803581 | 0.720928 |
| 2001 | 1.026 | 1.046581 | 1.009678 |
| 2002 | 1.116 | 1.231081 | 1.206178 |
| 2003 | 1.152 | 1.177081 | 1.233778 |
| 2004 | 1.044 | 0.989581 | 1.112878 |
| 2005 | 1.206 | 1.201081 | 1.344628 |
| 2006 | 1.134 | 1.043581 | 1.192078 |
| 2007 | 1.116 | 1.129081 | 1.254928 |
| 2008 | 0.972 | 0.658081 | 0.895678 |
| 2009 | 1.152 | 1.010581 | 1.182178 |
| 2010 | 1.296 | 1.433581 | 1.607278 |
| 2011 | 1.026 | 0.872581 | 1.042528 |
| 2012 | 1.152 | 0.934081 | 1.149628 |
| 2013 | 1.206 | 1.084081 | 1.276378 |
| 2014 | 1.332 | 1.165081 | 1.372378 |
| 2015 | 1.674 | 1.330081 | 1.596328 |
| 2016 | 1.782 | 1.786081 | 1.936978 |
| 2017 | 1.638 | 1.562581 | 1.715728 |
| 2018 | 1.476 | 1.244581 | 1.471528 |
| 2019 | 1.71 | 1.633081 | 1.827778 |
| 2020 | 1.764 | 1.729081 | 1.938778 |
| 2021 | 1.512 | 1.328581 | 1.599028 |
Figure 2. Temperatures Worldwide, 1901-2021
Data source: NOAA, 2022
Web update: July 2022
Units: °F
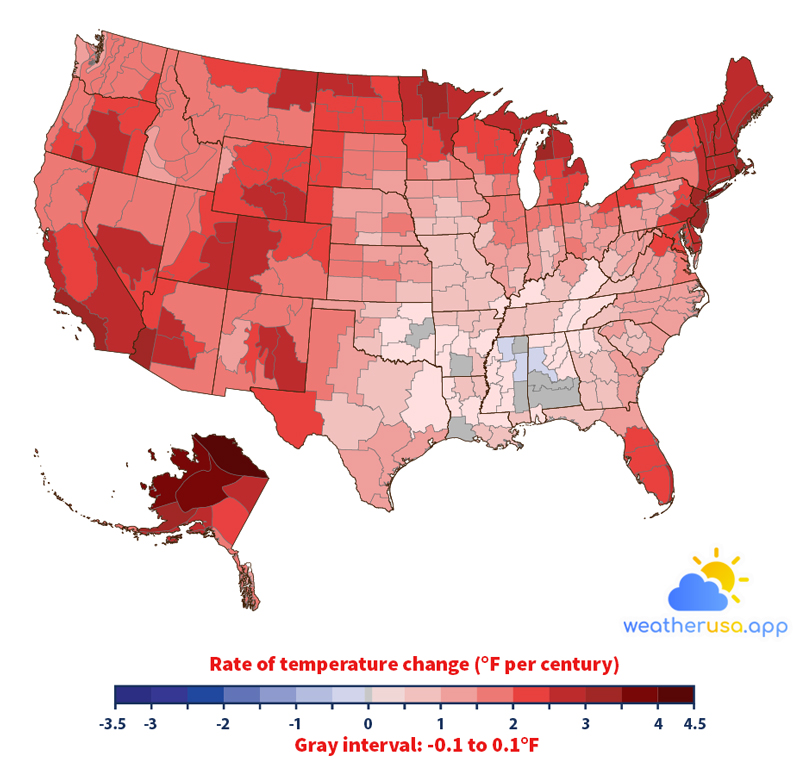
This figure shows how annual average air temperatures have changed in different parts of the United States since the early 20th century. The data are shown for climate divisions, as defined by the National Oceanic and Atmospheric Administration.
| Climate Division |
Temperature Change
|
| 101 | 169.506.164 |
| 102 | 229.451.745 |
| 103 | -206.859.956 |
| 104 | 277.881.272 |
| 105 | 220.086.483 |
| 106 | 1.919.907 |
| 107 | -33.588.493 |
| 108 | 487.846.046 |
| 201 | 2.349.692.905 |
| 202 | 1.814.010.071 |
| 203 | 2.576.756.763 |
| 204 | 2.356.117.057 |
| 205 | 3.009.376.552 |
| 206 | 293.468.026 |
| 207 | 187.341.372 |
| 301 | 539.137.651 |
| 302 | 79.836.743 |
| 303 | 720.809.059 |
| 304 | 414.222.328 |
| 305 | 224.286.456 |
| 306 | 409.203.812 |
| 307 | 215.000.226 |
| 308 | -70.660.028 |
| 309 | 517.528.113 |
| 401 | 1.977.566.274 |
| 402 | 1.735.565.416 |
| 403 | 2.017.545.048 |
| 404 | 2.705.290.611 |
| 405 | 2.038.155.399 |
| 406 | 3.468.607.461 |
| 407 | 2.888.187.012 |
| 501 | 1.528.152.238 |
| 502 | 2.801.206.928 |
| 503 | 2.405.573.996 |
| 504 | 2.271.671.634 |
| 505 | 160.939.123 |
| 601 | 2.737.744.434 |
| 602 | 2.860.909.768 |
| 603 | 3.165.317.482 |
| 701 | 2.673.435.171 |
| 702 | 2.789.532.809 |
| 801 | 530.054.645 |
| 802 | 1.349.591.293 |
| 803 | 2.125.191.934 |
| 804 | 2.272.100.664 |
| 805 | 2.465.660.705 |
| 806 | 2.820.535.835 |
| 807 | 2.837.409.113 |
| 901 | 226.691.279 |
| 902 | 349.359.843 |
| 903 | 555.090.774 |
| 904 | 603.147.722 |
| 905 | 843.398.591 |
| 906 | 1.027.113.535 |
| 907 | 756.108.025 |
| 908 | 815.601.996 |
| 909 | 1.111.750.892 |
| 1001 | 1.637.165.244 |
| 1002 | 1.851.228.379 |
| 1003 | 1.918.331.979 |
| 1004 | 1.887.199.115 |
| 1005 | 1.404.986.903 |
| 1006 | 1.391.003.929 |
| 1007 | 1.989.144.425 |
| 1008 | 193.468.026 |
| 1009 | 1.530.878.833 |
| 1010 | 1.599.077.587 |
| 1101 | 15.485.763 |
| 1102 | 1.725.629.996 |
| 1103 | 795.776.318 |
| 1104 | 1.642.674.886 |
| 1105 | 1.727.250.147 |
| 1106 | 1.129.979 |
| 1107 | 1.206.487.378 |
| 1108 | 1.096.362.282 |
| 1109 | 711.381.701 |
| 1201 | 1.827.484.984 |
| 1202 | 1.796.188.412 |
| 1203 | 1.892.974.078 |
| 1204 | 116.409.249 |
| 1205 | 912.404.597 |
| 1206 | 1.244.659.712 |
| 1207 | 1.016.184.573 |
| 1208 | 815.624.577 |
| 1209 | 1.062.186.696 |
| 1301 | 1.397.428.081 |
| 1302 | 1.211.048.638 |
| 1303 | 1.063.643.138 |
| 1304 | 1.177.550.467 |
| 1305 | 827.055.954 |
| 1306 | 1.108.996.071 |
| 1307 | 83.543.332 |
| 1308 | 571.822.924 |
| 1309 | 693.452.784 |
| 1401 | 1.840.350.224 |
| 1402 | 1.246.217.766 |
| 1403 | 1.146.886.149 |
| 1404 | 1.839.955.065 |
| 1405 | 1.518.166.012 |
| 1406 | 1.149.358.714 |
| 1407 | 1.423.333.559 |
| 1408 | 1.133.693.492 |
| 1409 | 610.616.222 |
| 1501 | 368.197.625 |
| 1502 | 779.066.748 |
| 1503 | 1.047.368.243 |
| 1504 | 372.758.885 |
| 1601 | 456.752.698 |
| 1602 | 663.798.943 |
| 1603 | 735.300.095 |
| 1604 | 47.830.014 |
| 1605 | 192.408.436 |
| 1606 | 399.691.776 |
| 1607 | 54.526.261 |
| 1608 | 503.646.751 |
| 1609 | 785.073.161 |
| 1701 | 2.714.853.453 |
| 1702 | 2.906.477.216 |
| 1703 | 3.014.434.584 |
| 1801 | 2.526.306.282 |
| 1802 | 2.401.114.348 |
| 1803 | 2.140.258.773 |
| 1804 | 2.395.870.027 |
| 1805 | 2.291.796.505 |
| 1806 | 2.489.217.811 |
| 1807 | 1.753.516.913 |
| 1808 | 1.152.136.115 |
| 1901 | 2.572.935.013 |
| 1902 | 2.739.443.616 |
| 1903 | 3.122.877.433 |
| 2001 | 2.568.125.367 |
| 2002 | 2.512.616.854 |
| 2003 | 3.171.007.768 |
| 2004 | 2.849.749.356 |
| 2005 | 2.254.041.909 |
| 2006 | 2.485.926.704 |
| 2007 | 2.623.972.587 |
| 2008 | 1.993.592.783 |
| 2009 | 2.112.360.565 |
| 2010 | 2.481.884.794 |
| 2101 | 2.720.650.996 |
| 2102 | 3.016.777.311 |
| 2103 | 2.837.990.561 |
| 2104 | 2.242.204.083 |
| 2105 | 2.387.464.436 |
| 2106 | 2.822.251.953 |
| 2107 | 1.554.334.327 |
| 2108 | 1.365.646.028 |
| 2109 | 1.683.443.978 |
| 2201 | 212.928.465 |
| 2202 | -107.336.404 |
| 2203 | -76.135.799 |
| 2204 | 47.692.273 |
| 2205 | 104.993.677 |
| 2206 | -186.571.377 |
| 2207 | 283.644.944 |
| 2208 | 194.553.584 |
| 2209 | 66.629.409 |
| 2210 | 630.605.609 |
| 2301 | 967.738.111 |
| 2302 | 974.817.098 |
| 2303 | 981.122.702 |
| 2304 | 65.506.029 |
| 2305 | 620.156.483 |
| 2306 | 415.176.354 |
| 2401 | 1.957.159.147 |
| 2402 | 1.962.510.726 |
| 2403 | 2.468.720.363 |
| 2404 | 1.713.464.752 |
| 2405 | 1.786.258.637 |
| 2406 | 2.529.563.519 |
| 2407 | 193.853.588 |
| 2501 | 2.309.539.132 |
| 2502 | 144.280.924 |
| 2503 | 1.147.862.756 |
| 2505 | 1.089.678.454 |
| 2506 | 1.500.095.967 |
| 2507 | 1.541.243.282 |
| 2508 | 963.092.174 |
| 2509 | 1.208.598.654 |
| 2601 | 1.934.194.779 |
| 2602 | 1.538.217.495 |
| 2603 | 2.829.003.523 |
| 2604 | 2.384.427.359 |
| 2701 | 2.604.361.423 |
| 2702 | 2.730.462.223 |
| 2801 | 3.324.707.583 |
| 2802 | 3.084.846.227 |
| 2803 | 3.506.254.798 |
| 2901 | 1.650.820.801 |
| 2902 | 1.598.625.977 |
| 2903 | 1.594.962.291 |
| 2904 | 137.973.626 |
| 2905 | 2.284.525.584 |
| 2906 | 2.533.961.071 |
| 2907 | 2.623.916.136 |
| 2908 | 1.874.695.163 |
| 3001 | 1.360.954.929 |
| 3002 | 17.870.546 |
| 3003 | 2.231.427.539 |
| 3004 | 3.585.280.901 |
| 3005 | 2.662.099.761 |
| 3006 | 1.465.846.995 |
| 3007 | 2.477.346.114 |
| 3008 | 3.124.266.134 |
| 3009 | 2.182.540.758 |
| 3010 | 1.627.675.789 |
| 3101 | 636.696.699 |
| 3102 | 1.318.757.621 |
| 3103 | 1.371.116.154 |
| 3104 | 1.124.486.294 |
| 3105 | 1.122.177.438 |
| 3106 | 1.141.077.316 |
| 3107 | 1.220.650.996 |
| 3108 | 1.168.331.979 |
| 3201 | 259.265.908 |
| 3202 | 2.570.947.929 |
| 3203 | 2.472.141.309 |
| 3204 | 2.406.883.665 |
| 3205 | 2.363.506.526 |
| 3206 | 2.181.417.378 |
| 3207 | 2.288.132.818 |
| 3208 | 2.215.378.449 |
| 3209 | 2.062.299.598 |
| 3301 | 1.831.865.601 |
| 3302 | 1.279.953.033 |
| 3303 | 2.381.943.504 |
| 3304 | 1.444.135.844 |
| 3305 | 1.278.180.463 |
| 3306 | 1.534.757.034 |
| 3307 | 1.732.883.981 |
| 3308 | 1.626.953.213 |
| 3309 | 1.105.518.674 |
| 3310 | 1.167.197.308 |
| 3401 | 1.018.222.463 |
| 3402 | 891.534.571 |
| 3403 | 235.599.286 |
| 3404 | 1.097.846.949 |
| 3405 | 339.017.974 |
| 3406 | -90.722.802 |
| 3407 | 881.903.988 |
| 3408 | 24.298.311 |
| 3409 | 262.729.757 |
| 3501 | 1.906.262.702 |
| 3502 | 1.727.498.532 |
| 3503 | 2.209.699.454 |
| 3504 | 1.774.720.002 |
| 3505 | 236.980.084 |
| 3506 | 2.171.363.411 |
| 3507 | 2.541.627.151 |
| 3508 | 211.482.184 |
| 3509 | 2.289.329.585 |
| 3601 | 2.301.342.411 |
| 3602 | 2.367.689.563 |
| 3603 | 2.673.079.529 |
| 3604 | 228.638.283 |
| 3605 | 1.487.733.144 |
| 3606 | 1.337.584.112 |
| 3607 | 1.085.484.126 |
| 3608 | 1.358.646.073 |
| 3609 | 1.087.606.693 |
| 3610 | 2.050.574.674 |
| 3701 | 3.348.625.977 |
| 3801 | 883.315.269 |
| 3802 | 1.152.051.438 |
| 3803 | 881.141.896 |
| 3804 | 1.040.012.645 |
| 3805 | 907.222.373 |
| 3806 | 826.231.766 |
| 3807 | 1.146.654.699 |
| 3901 | 2.106.348.507 |
| 3902 | 1.559.138.328 |
| 3903 | 1.762.786.208 |
| 3904 | 202.893.691 |
| 3905 | 2.138.966.039 |
| 3906 | 1.760.787.834 |
| 3907 | 1.668.422.301 |
| 3908 | 1.942.515.693 |
| 3909 | 1.434.527.842 |
| 4001 | 424.456.939 |
| 4002 | 477.950.142 |
| 4003 | 554.791.582 |
| 4004 | 631.271.734 |
| 4101 | 1.617.898.433 |
| 4102 | 1.003.121.754 |
| 4103 | 584.293.005 |
| 4104 | 498.475.816 |
| 4105 | 2.205.855.124 |
| 4106 | 688.981.845 |
| 4107 | 1.216.885.698 |
| 4108 | 1.481.427.539 |
| 4109 | 1.218.714.718 |
| 4110 | 1.089.542.971 |
| 4201 | 1.946.032.606 |
| 4202 | 2.152.096.599 |
| 4203 | 1.890.947.478 |
| 4204 | 2.231.817.053 |
| 4205 | 2.160.807.027 |
| 4206 | 2.983.104.141 |
| 4207 | 2.981.388.023 |
| 4301 | 2.510.957.187 |
| 4302 | 268.829.314 |
| 4303 | 2.733.442.849 |
| 4401 | 1.549.739.195 |
| 4402 | 1.476.781.601 |
| 4403 | 1.395.277.289 |
| 4404 | 2.095.927.607 |
| 4405 | 1.288.590.074 |
| 4406 | 877.404.823 |
| 4501 | 1.446.348.733 |
| 4502 | 1.449.927.742 |
| 4503 | 1.386.019.284 |
| 4504 | 1.515.021.677 |
| 4505 | 1.599.066.296 |
| 4506 | 1.763.960.394 |
| 4507 | 1.530.105.451 |
| 4508 | 1.777.079.664 |
| 4509 | 1.554.814.162 |
| 4510 | 2.082.870.433 |
| 4601 | 1.206.131.735 |
| 4602 | 1.319.310.843 |
| 4603 | 613.529.106 |
| 4604 | 1.127.218.534 |
| 4605 | 615.476.674 |
| 4606 | 1.405.568.351 |
| 4701 | 21.645.441 |
| 4702 | 2.037.557.016 |
| 4703 | 2.468.692.137 |
| 4704 | 1.854.327.553 |
| 4705 | 2.019.227.295 |
| 4706 | 2.315.432.642 |
| 4707 | 1.281.528.022 |
| 4708 | 1.625.982.252 |
| 4709 | 1.549.372.262 |
| 4801 | 1.819.559.229 |
| 4802 | 1.405.099.806 |
| 4803 | 2.149.962.742 |
| 4804 | 2.146.745.021 |
| 4805 | 2.005.752.382 |
| 4806 | 2.149.714.357 |
| 4807 | 2.063.914.104 |
| 4808 | 2.676.568.216 |
| 4809 | 2.091.456.668 |
| 4810 | 2.726.775.956 |
Data source: NOAA, 2022
Web update: July 2022
Units: °F per century
Key Points
- Since 1901, the average surface temperature across the contiguous 48 states has risen at an average rate of 0.17°F per decade (see Figure 1). Average temperatures have risen more quickly since the late 1970s (0.32 to 0.55°F per decade since 1979). Nine of the top 10 warmest years on record for the contiguous 48 states have occurred since 1998, and 2012 and 2016 were the two warmest years.
- Worldwide, 2016 was the warmest year on record, 2020 was the second-warmest, and 2012–2021 was the warmest decade since thermometer-based observations began. The global average surface temperature has risen at an average rate of 0.17°F per decade since 1901 (see Figure 2), similar to the speed of warming within the contiguous 48 states. Since the late 1970s, however, the United States has warmed faster than the global rate.
- Some parts of the United States have experienced more warming than others (see Figure 3). The North, the West, and Alaska have seen temperatures increase the most, while some parts of the Southeast have experienced little change. Not all of these regional trends are statistically significant, however.
Background
Temperature is a fundamental measurement for describing the climate, and the temperature in particular places can have wide-ranging effects on human life and ecosystems. For example, increases in air temperature can lead to more intense heat waves, which can cause illness and death, especially in vulnerable populations.
Annual and seasonal temperature patterns also determine the types of animals and plants that can survive in particular locations. Temperature changes can disrupt a wide range of natural processes, mainly if these changes occur more quickly than plant and animal species can adapt.
Concentrations of heat-trapping greenhouse gases are increasing in the Earth’s atmosphere. In response, average temperatures at the Earth’s surface are growing and are expected to continue rising. Because climate change can shift the wind patterns and ocean currents that drive the world’s climate system, some areas are warming more than others, and some have experienced cooling.
About the Indicator
- This indicator examines U.S. and global surface temperature patterns over time. U.S. surface measurements come from weather stations on land, while global surface measurements also incorporate observations from buoys and ships on the ocean, thereby providing data from sites spanning much of the surface of the Earth.
This indicator starts in 1901, except for the detailed map of Alaska, where reliable statewide records are available back to 1925. For comparison, this indicator also displays satellite measurements that can be used to estimate the temperature of the Earth’s lower atmosphere since 1979. - This indicator shows annual anomalies, or differences, compared with the average temperature from 1901 to 2000. For example, a peculiarity of +2.0 degrees means the average temperature was 2 degrees higher than the long-term average. Anomalies have been calculated for each weather station. Daily temperature measurements at each site were used to calculate monthly anomalies, which were then averaged to find an annual temperature anomaly for each year.
Oddities for the contiguous 48 states and Alaska have been determined by calculating average anomalies for areas within each state based on station density, interpolation, and topography. These regional anomalies are then averaged together in proportion to their site to develop national results. Similarly, global anomalies have been determined by dividing the world into a grid, averaging the data for each grid cell, and then averaging the grid cells together.
About the Data
Indicator Notes
Data from the early 20th century are somewhat less precise than more recent data because fewer stations were collecting measurements at the time, especially in the Southern Hemisphere. The overall trends are still reliable, however.
Where possible, the data have been adjusted to account for any biases that might be introduced by factors such as station moves, urbanization near the station, changes in measuring instruments, and changes in the exact times’ measurements are taken.
Hawaii and U.S. territories are not included due to limitations in available data.
Data Sources
The data for this indicator were provided by the National Oceanic and Atmospheric Administration’s National Centers for Environmental Information, which maintains an extensive collection of climate data online. The surface temperature anomalies shown here were calculated based on monthly values from a network of long-term monitoring stations.
Two independent groups analyzed Satellite data—the Global Hydrology and Climate Center at the University of Alabama in Huntsville (UAH) and Remote Sensing Systems (RSS)—resulting in slightly different trend lines.
Weather 01852 - Lowell MA

48°
light rain
Feels like 45°05:33/19:49
50°F
/47°F
81%
1021 hPa
6 mi
6.91 mph

