U.S. and Global Precipitation
Precipitation
In meteorology, precipitation is any product of the condensation of atmospheric water vapor that falls under clouds’ gravitational attraction. The primary forms of precipitation are drizzle, rain, sleet, snow, sleet, graupel, and hail.
Precipitation occurs when part of the atmosphere becomes saturated with water vapor so that water condenses and “precipitates” or falls. Thus, fog and mist are not precipitation but colloids because water vapor does not condense enough to precipitate.
Two processes, possibly acting together, can lead to air saturation: the cooling of the air or the addition of water vapor to the air—precipitation forms when smaller droplets coalesce by colliding with other raindrops or ice crystals in a cloud. Short, intense periods of rain in scattered locations are called downpours.
Climate Change Indicators: U.S. and Global Precipitation

| Year | Anomaly |
| 1901 | -2.31 |
| 1902 | 0.69 |
| 1903 | -0.58 |
| 1904 | -1.99 |
| 1905 | 2.66 |
| 1906 | 2.9 |
| 1907 | 1 |
| 1908 | -0.14 |
| 1909 | 1.25 |
| 1910 | -5.03 |
| 1911 | -0.42 |
| 1912 | 0.54 |
| 1913 | -0.1 |
| 1914 | -1.13 |
| 1915 | 2.83 |
| 1916 | -0.52 |
| 1917 | -4.59 |
| 1918 | -1.16 |
| 1919 | 1.82 |
| 1920 | 1.36 |
| 1921 | -1.16 |
| 1922 | -0.05 |
| 1923 | 1.74 |
| 1924 | -3.42 |
| 1925 | -2.98 |
| 1926 | 1 |
| 1927 | 2.12 |
| 1928 | -0.44 |
| 1929 | 0.21 |
| 1930 | -4.36 |
| 1931 | -2.42 |
| 1932 | 0.5 |
| 1933 | -2.44 |
| 1934 | -4.15 |
| 1935 | -0.46 |
| 1936 | -2.66 |
| 1937 | 0.57 |
| 1938 | -0.2 |
| 1939 | -3.61 |
| 1940 | 0.47 |
| 1941 | 2.87 |
| 1942 | 1.39 |
| 1943 | -3.13 |
| 1944 | 0.68 |
| 1945 | 3.09 |
| 1946 | 1.15 |
| 1947 | -0.59 |
| 1948 | 0.75 |
| 1949 | 0.36 |
| 1950 | 0.93 |
| 1951 | 1.31 |
| 1952 | -3.6 |
| 1953 | -1.63 |
| 1954 | -3.79 |
| 1955 | -2.2 |
| 1956 | -4.56 |
| 1957 | 3.93 |
| 1958 | 0.29 |
| 1959 | 0.66 |
| 1960 | -1.19 |
| 1961 | 1.31 |
| 1962 | -1.34 |
| 1963 | -4.24 |
| 1964 | 0.32 |
| 1965 | -0.14 |
| 1966 | -2.48 |
| 1967 | -0.34 |
| 1968 | 0.45 |
| 1969 | 0.69 |
| 1970 | -0.24 |
| 1971 | 0.39 |
| 1972 | 1.76 |
| 1973 | 5.02 |
| 1974 | 0.68 |
| 1975 | 3.09 |
| 1976 | -3.63 |
| 1977 | 0.5 |
| 1978 | 0.2 |
| 1979 | 2.81 |
| 1980 | -1.67 |
| 1981 | 0.02 |
| 1982 | 3.92 |
| 1983 | 4.82 |
| 1984 | 1.46 |
| 1985 | 0.03 |
| 1986 | 1.44 |
| 1987 | -0.93 |
| 1988 | -4.04 |
| 1989 | -0.89 |
| 1990 | 2.23 |
| 1991 | 2.5 |
| 1992 | 1.32 |
| 1993 | 2.68 |
| 1994 | 0.68 |
| 1995 | 2.75 |
| 1996 | 3.76 |
| 1997 | 1.92 |
| 1998 | 3.95 |
| 1999 | -1.47 |
| 2000 | -1.72 |
| 2001 | -0.92 |
| 2002 | -0.89 |
| 2003 | 0.57 |
| 2004 | 3.31 |
| 2005 | 0.14 |
| 2006 | -0.12 |
| 2007 | -0.76 |
| 2008 | 1.3 |
| 2009 | 2.36 |
| 2010 | 1.43 |
| 2011 | 0.16 |
| 2012 | -2.41 |
| 2013 | 1.12 |
| 2014 | 0.91 |
| 2015 | 4.65 |
| 2016 | 1.48 |
| 2017 | 2.37 |
| 2018 | 4.71 |
| 2019 | 4.88 |
| 2020 | 0.44 |
| 2021 | 0.54 |
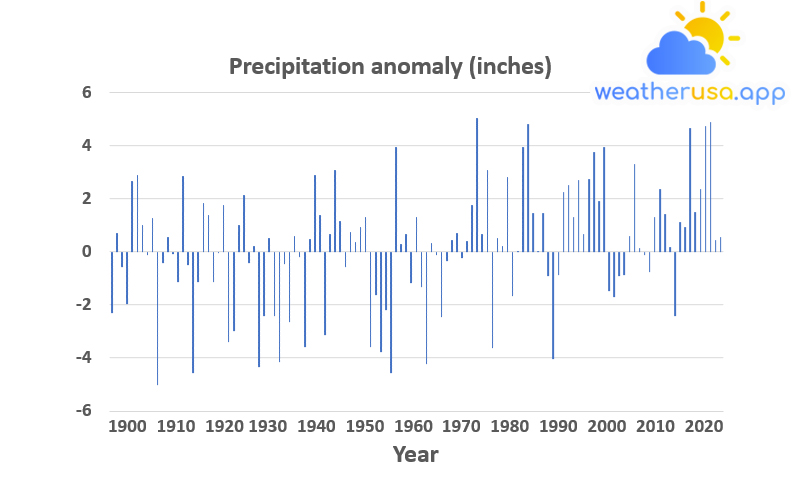
Figure 1. Precipitation in the Contiguous 48 States, 1901-2021
Data source: NOAA, 2022
Web update: July 2022
Units: inches
| Year | Anomaly |
| 1901 | -0.37563 |
| 1902 | -0.58587 |
| 1903 | 0.134996 |
| 1904 | -0.08744 |
| 1905 | -0.19374 |
| 1906 | 0.405862 |
| 1907 | -0.34374 |
| 1908 | -0.02052 |
| 1909 | 0.259799 |
| 1910 | 0.131847 |
| 1911 | -0.45674 |
| 1912 | -0.32682 |
| 1913 | -0.45792 |
| 1914 | -0.48036 |
| 1915 | -0.10634 |
| 1916 | 0.61728 |
| 1917 | 0.342477 |
| 1918 | -0.46264 |
| 1919 | -0.56776 |
| 1920 | -0.23272 |
| 1921 | 0.233028 |
| 1922 | -0.16894 |
| 1923 | 0.107831 |
| 1924 | -0.12485 |
| 1925 | -0.19099 |
| 1926 | 0.30665 |
| 1927 | 0.211768 |
| 1928 | -0.29571 |
| 1929 | -0.42603 |
| 1930 | -0.70241 |
| 1931 | 0.09287 |
| 1932 | -0.12603 |
| 1933 | 0.401532 |
| 1934 | 0.179484 |
| 1935 | 0.007831 |
| 1936 | -0.14296 |
| 1937 | -0.04296 |
| 1938 | -0.07288 |
| 1939 | 0.051925 |
| 1940 | -0.67406 |
| 1941 | -0.76185 |
| 1942 | -0.10674 |
| 1943 | -0.50044 |
| 1944 | -0.4965 |
| 1945 | -0.31422 |
| 1946 | -0.42563 |
| 1947 | 0.102319 |
| 1948 | -0.23548 |
| 1949 | 0.070035 |
| 1950 | 0.700351 |
| 1951 | -0.54217 |
| 1952 | -0.31894 |
| 1953 | 0.218854 |
| 1954 | 0.560587 |
| 1955 | 0.857044 |
| 1956 | 1.125548 |
| 1957 | 0.084209 |
| 1958 | -0.32091 |
| 1959 | 0.218461 |
| 1960 | 0.143658 |
| 1961 | 0.603107 |
| 1962 | 0.030272 |
| 1963 | -0.15674 |
| 1964 | -0.04178 |
| 1965 | -1.06658 |
| 1966 | 0.14287 |
| 1967 | -0.09689 |
| 1968 | 0.049957 |
| 1969 | -0.09611 |
| 1970 | -0.07052 |
| 1971 | 0.03224 |
| 1972 | -0.77248 |
| 1973 | 1.344446 |
| 1974 | 1.18106 |
| 1975 | 0.97476 |
| 1976 | -0.12406 |
| 1977 | 0.572398 |
| 1978 | 0.709012 |
| 1979 | 0.040508 |
| 1980 | -0.29768 |
| 1981 | 0.396414 |
| 1982 | -0.14532 |
| 1983 | -0.29886 |
| 1984 | 0.381059 |
| 1985 | -0.0965 |
| 1986 | -0.42445 |
| 1987 | -1.35201 |
| 1988 | 0.629485 |
| 1989 | 0.416492 |
| 1990 | 0.045626 |
| 1991 | -0.46933 |
| 1992 | -1.06697 |
| 1993 | -0.0843 |
| 1994 | -0.08115 |
| 1995 | 0.048382 |
| 1996 | 0.492477 |
| 1997 | -0.1591 |
| 1998 | 0.767674 |
| 1999 | 0.961768 |
| 2000 | 1.203501 |
| 2001 | 0.092476 |
| 2002 | -0.57642 |
| 2003 | -0.29847 |
| 2004 | 0.239327 |
| 2005 | -0.40989 |
| 2006 | 0.66728 |
| 2007 | 0.489721 |
| 2008 | 0.977123 |
| 2009 | -0.11343 |
| 2010 | 1.387753 |
| 2011 | 0.965705 |
| 2012 | 0.282634 |
| 2013 | 0.74287 |
| 2014 | 0.12791 |
| 2015 | -0.83823 |
| 2016 | 0.479878 |
| 2017 | 0.921217 |
| 2018 | 0.522398 |
| 2019 | -0.35398 |
| 2020 | -0.25556 |
| 2021 | -0.07524 |
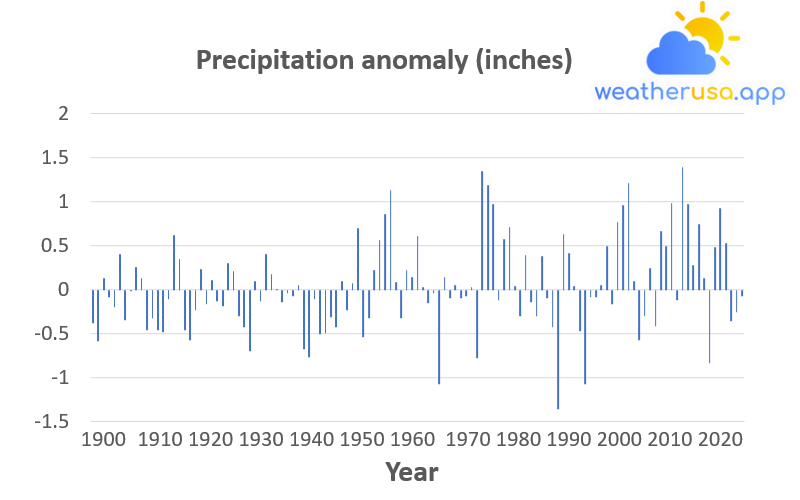
Figure 2. Precipitation Worldwide, 1901-2021
Data source: Blunden and Boyer, 2022
Web update: July 2022
Units: inches
| Climate Division ID | Precipitation Change (1901-2000 denominator) |
| 101 | 16.31% |
| 102 | 10.24% |
| 103 | 9.84% |
| 104 | 6.17% |
| 105 | 7.00% |
| 106 | 4.75% |
| 107 | 5.79% |
| 108 | 6.83% |
| 201 | -11.90% |
| 202 | -13.99% |
| 203 | -9.75% |
| 204 | -15.07% |
| 205 | -10.25% |
| 206 | -11.39% |
| 207 | -3.44% |
| 301 | 10.51% |
| 302 | 11.45% |
| 303 | 9.05% |
| 304 | 15.72% |
| 305 | 10.11% |
| 306 | 3.73% |
| 307 | 16.11% |
| 308 | 12.11% |
| 309 | 8.35% |
| 401 | -2.40% |
| 402 | 1.17% |
| 403 | -3.99% |
| 404 | -0.26% |
| 405 | -2.26% |
| 406 | -15.21% |
| 407 | -13.79% |
| 501 | -2.40% |
| 502 | -3.57% |
| 503 | -4.35% |
| 504 | 3.54% |
| 505 | -6.21% |
| 601 | 4.81% |
| 602 | 9.80% |
| 603 | 4.62% |
| 701 | 7.04% |
| 702 | 6.57% |
| 801 | 3.06% |
| 802 | 4.46% |
| 803 | -0.74% |
| 804 | -1.38% |
| 805 | 2.77% |
| 806 | 2.83% |
| 807 | -0.30% |
| 901 | 6.44% |
| 902 | 7.23% |
| 903 | -0.83% |
| 904 | 3.56% |
| 905 | -1.30% |
| 906 | 0.86% |
| 907 | 1.66% |
| 908 | 1.07% |
| 909 | 1.38% |
| 1001 | 10.77% |
| 1002 | 1.59% |
| 1003 | -0.41% |
| 1004 | 0.42% |
| 1005 | 2.26% |
| 1006 | -1.62% |
| 1007 | -2.58% |
| 1008 | -5.83% |
| 1009 | 0.18% |
| 1010 | 6.40% |
| 1101 | 17.63% |
| 1102 | 19.44% |
| 1103 | 17.43% |
| 1104 | 14.83% |
| 1105 | 15.50% |
| 1106 | 12.03% |
| 1107 | 17.08% |
| 1108 | 14.73% |
| 1109 | 15.66% |
| 1201 | 14.29% |
| 1202 | 13.01% |
| 1203 | 13.13% |
| 1204 | 16.94% |
| 1205 | 16.62% |
| 1206 | 12.02% |
| 1207 | 17.39% |
| 1208 | 18.81% |
| 1209 | 20.15% |
| 1301 | 10.87% |
| 1302 | 16.06% |
| 1303 | 20.19% |
| 1304 | 15.56% |
| 1305 | 16.58% |
| 1306 | 17.58% |
| 1307 | 16.35% |
| 1308 | 14.97% |
| 1309 | 15.39% |
| 1401 | 4.97% |
| 1402 | 13.01% |
| 1403 | 9.35% |
| 1404 | 9.70% |
| 1405 | 14.51% |
| 1406 | 11.60% |
| 1407 | 9.87% |
| 1408 | 16.97% |
| 1409 | 16.60% |
| 1501 | 15.44% |
| 1502 | 14.20% |
| 1503 | 15.42% |
| 1504 | 9.36% |
| 1601 | 12.22% |
| 1602 | 12.80% |
| 1603 | 12.23% |
| 1604 | 16.23% |
| 1605 | 11.81% |
| 1606 | 10.90% |
| 1607 | 12.57% |
| 1608 | 10.75% |
| 1609 | 8.13% |
| 1701 | 14.54% |
| 1702 | 13.24% |
| 1703 | 16.36% |
| 1801 | 9.29% |
| 1802 | 6.23% |
| 1803 | 8.27% |
| 1804 | 8.52% |
| 1805 | 4.17% |
| 1806 | 10.81% |
| 1807 | 8.53% |
| 1808 | 9.67% |
| 1901 | 12.82% |
| 1902 | 19.60% |
| 1903 | 19.36% |
| 2001 | 9.42% |
| 2002 | 15.79% |
| 2003 | 23.27% |
| 2004 | 17.27% |
| 2005 | 24.38% |
| 2006 | 23.06% |
| 2007 | 17.58% |
| 2008 | 18.46% |
| 2009 | 21.05% |
| 2010 | 19.65% |
| 2101 | 12.12% |
| 2102 | 10.83% |
| 2103 | 12.35% |
| 2104 | 16.91% |
| 2105 | 20.46% |
| 2106 | 18.03% |
| 2107 | 17.47% |
| 2108 | 18.22% |
| 2109 | 21.67% |
| 2201 | 11.81% |
| 2202 | 14.71% |
| 2203 | 18.84% |
| 2204 | 13.70% |
| 2205 | 18.66% |
| 2206 | 15.44% |
| 2207 | 13.00% |
| 2208 | 10.92% |
| 2209 | 6.48% |
| 2210 | 9.88% |
| 2301 | 9.13% |
| 2302 | 13.28% |
| 2303 | 9.70% |
| 2304 | 11.22% |
| 2305 | 12.09% |
| 2306 | 13.43% |
| 2401 | 0.83% |
| 2402 | -7.75% |
| 2403 | -0.39% |
| 2404 | -2.78% |
| 2405 | 5.79% |
| 2406 | 5.34% |
| 2407 | 7.41% |
| 2501 | -0.95% |
| 2502 | 12.69% |
| 2503 | 8.13% |
| 2505 | 9.13% |
| 2506 | 9.36% |
| 2507 | 1.04% |
| 2508 | 11.24% |
| 2509 | 7.75% |
| 2601 | 4.85% |
| 2602 | 0.66% |
| 2603 | -3.39% |
| 2604 | -11.44% |
| 2701 | 16.90% |
| 2702 | 19.58% |
| 2801 | 8.85% |
| 2802 | 8.48% |
| 2803 | 7.87% |
| 2901 | -11.33% |
| 2902 | -1.64% |
| 2903 | -2.18% |
| 2904 | -7.42% |
| 2905 | -1.25% |
| 2906 | -3.31% |
| 2907 | -4.27% |
| 2908 | 5.13% |
| 3001 | 11.60% |
| 3002 | 14.79% |
| 3003 | 11.94% |
| 3004 | 4.88% |
| 3005 | 13.41% |
| 3006 | 11.44% |
| 3007 | 19.63% |
| 3008 | 15.91% |
| 3009 | 16.17% |
| 3010 | 17.62% |
| 3101 | 3.91% |
| 3102 | 3.64% |
| 3103 | 3.31% |
| 3104 | -2.07% |
| 3105 | -4.06% |
| 3106 | 7.33% |
| 3107 | 4.93% |
| 3108 | 3.88% |
| 3201 | 6.99% |
| 3202 | 13.54% |
| 3203 | 12.23% |
| 3204 | 5.47% |
| 3205 | 7.96% |
| 3206 | 11.84% |
| 3207 | 3.71% |
| 3208 | 9.90% |
| 3209 | 11.26% |
| 3301 | 11.36% |
| 3302 | 8.91% |
| 3303 | 17.24% |
| 3304 | 11.61% |
| 3305 | 6.54% |
| 3306 | 10.86% |
| 3307 | 9.80% |
| 3308 | 9.36% |
| 3309 | 7.30% |
| 3310 | 7.82% |
| 3401 | 2.48% |
| 3402 | 13.78% |
| 3403 | 16.05% |
| 3404 | 9.57% |
| 3405 | 16.98% |
| 3406 | 15.18% |
| 3407 | 9.44% |
| 3408 | 12.78% |
| 3409 | 15.24% |
| 3501 | 1.85% |
| 3502 | 4.53% |
| 3503 | 1.45% |
| 3504 | 5.26% |
| 3505 | 3.81% |
| 3506 | 3.70% |
| 3507 | -1.10% |
| 3508 | 0.96% |
| 3509 | 3.58% |
| 3601 | 12.52% |
| 3602 | 9.04% |
| 3603 | 10.74% |
| 3604 | 7.69% |
| 3605 | 6.55% |
| 3606 | 13.71% |
| 3607 | 7.57% |
| 3608 | 9.35% |
| 3609 | 10.07% |
| 3610 | 11.56% |
| 3701 | 15.35% |
| 3801 | -0.39% |
| 3802 | -4.93% |
| 3803 | -5.12% |
| 3804 | 6.03% |
| 3805 | 2.38% |
| 3806 | 3.30% |
| 3807 | 8.46% |
| 3901 | 9.76% |
| 3902 | 10.31% |
| 3903 | 5.22% |
| 3904 | 2.05% |
| 3905 | 4.95% |
| 3906 | 21.12% |
| 3907 | 15.97% |
| 3908 | 17.87% |
| 3909 | 11.63% |
| 4001 | 8.99% |
| 4002 | 14.85% |
| 4003 | 13.74% |
| 4004 | 16.32% |
| 4101 | -1.89% |
| 4102 | 7.82% |
| 4103 | 16.96% |
| 4104 | 14.43% |
| 4105 | 3.99% |
| 4106 | 3.59% |
| 4107 | 12.09% |
| 4108 | 21.21% |
| 4109 | 7.48% |
| 4110 | 13.40% |
| 4201 | 3.50% |
| 4202 | -6.51% |
| 4203 | 5.14% |
| 4204 | -3.74% |
| 4205 | -2.34% |
| 4206 | -4.03% |
| 4207 | -8.45% |
| 4301 | 20.32% |
| 4302 | 21.46% |
| 4303 | 20.80% |
| 4401 | 10.66% |
| 4402 | 8.00% |
| 4403 | 9.61% |
| 4404 | 12.95% |
| 4405 | 8.97% |
| 4406 | 4.99% |
| 4501 | 4.78% |
| 4502 | 9.17% |
| 4503 | 11.55% |
| 4504 | 8.91% |
| 4505 | 8.80% |
| 4506 | 2.53% |
| 4507 | 3.81% |
| 4508 | 5.45% |
| 4509 | 11.78% |
| 4510 | 1.48% |
| 4601 | 7.82% |
| 4602 | 5.61% |
| 4603 | 5.62% |
| 4604 | 2.86% |
| 4605 | -0.20% |
| 4606 | 10.74% |
| 4701 | 13.82% |
| 4702 | 9.82% |
| 4703 | 11.66% |
| 4704 | 15.09% |
| 4705 | 11.23% |
| 4706 | 11.59% |
| 4707 | 18.92% |
| 4708 | 18.69% |
| 4709 | 16.33% |
| 4801 | 6.80% |
| 4802 | 9.09% |
| 4803 | 1.49% |
| 4804 | 1.98% |
| 4805 | -2.88% |
| 4806 | 1.34% |
| 4807 | 0.28% |
| 4808 | -3.51% |
| 4809 | -2.01% |
| 4810 | -2.42% |
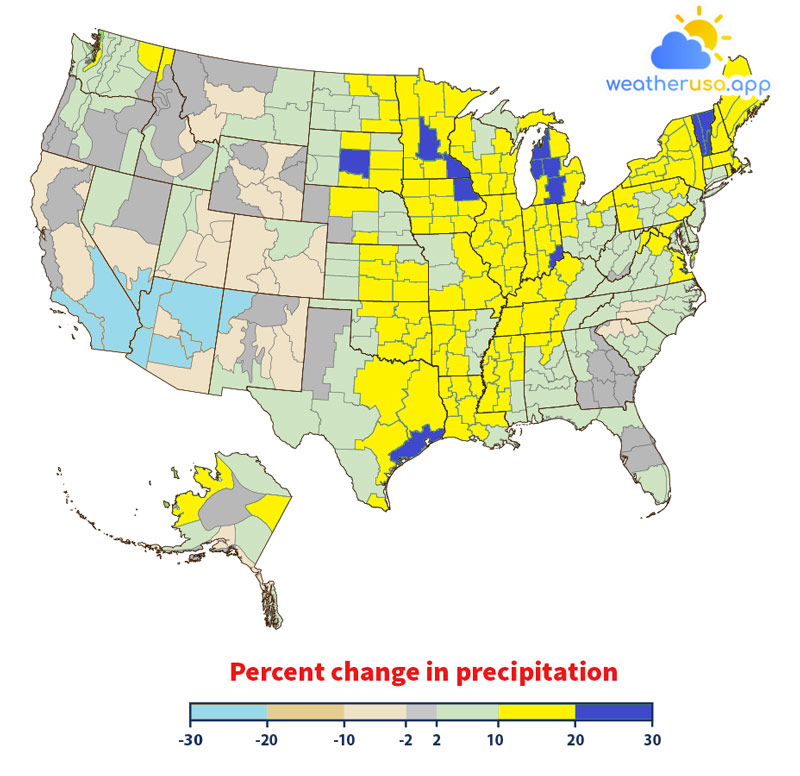
Figure 3. Change in Precipitation in the United States, 1901-2021
Data source: NOAA, 2022
Web update: July 2022
Units: percent change
Key Points
- On average, total annual precipitation has increased in terrestrial areas in the United States and worldwide (see Figures 1 and 2).
Since 1901, global precipitation has increased by an average of 0.04 inches per decade, while rainfall in the 48 contiguous states has increased by 0.20 inches per decade. - Some areas of the United States experienced more significant increases in precipitation than others.
A few places, such as the Southwest, have seen a decrease in precipitation (see Figure 3). However, not all of these regional trends are statistically significant.
Background
Precipitation can have far-reaching effects on human well-being and ecosystems. The timing of rainfall, snowfall, and snowmelt can affect the amount of surface water and groundwater available for drinking, irrigation, and industry.
They also affect river flooding and determine what kinds of animals and plants can survive in a given location. Changes in precipitation can disrupt various natural processes, mainly if these changes occur faster than plant and animal species can adapt.
Climate change will also alter the wind patterns and ocean currents that drive the world’s climate system, resulting in reduced precipitation in some areas. Additionally, higher temperatures cause more evaporation, so increased precipitation does not necessarily increase the amount of water available for drinking, irrigation, and industry.
About the Indicator
This indicator examines U.S. and global precipitation patterns based on precipitation and snowfall measurements from land-based weather stations worldwide. This indicator begins in 1901, except for the detailed map of Alaska, where reliable records are found throughout the state until 1925. The needle extends to 2021.
The monsters for the 48 contiguous states and Alaska were determined by calculating average precipitation anomalies for areas within each state based on station density and topography. These regional anomalies are then averaged to improve national results in proportion to their place.
Similarly, spherical aberrations were determined by dividing the world into a grid, averaging the data for each grid cell, and then averaging the grid cells together.
About the Data
Indicator Notes
Data from the early 20th century were slightly less accurate as fewer stations collected measurements. To ensure that overall trends are reliable, data have been adjusted whenever possible to account for any biases introduced by factors such as station displacement or changes in measuring instruments.

Weather 01852 - Lowell MA

48°
light rain
Feels like 46°05:32/19:50
50°F
/47°F
82%
1019 hPa
6 mi
4.61 mph


