
Tropical Cyclone Activity
Cyclone
In meteorology, a cyclone is a large mass of air that rotates around an intense center of low atmospheric pressure, counterclockwise in the northern and the southern hemispheres when viewed from above.
Cyclones are characterized by inward-spiraling winds that revolve around an area of low pressure. The largest low-pressure systems are the largest-scale polar vortices and extratropical cyclones. Hot-core storms, such as tropical and subtropical cyclones, also fall within the synoptic scale.

Climate Change Indicators: Tropical Cyclone Activity
This indicator examines the frequency, intensity, and duration of hurricanes and other tropical storms in the Atlantic Ocean, the Caribbean, and the Gulf of Mexico.
Figure 1. Number of Hurricanes in the North Atlantic, 1878–2020
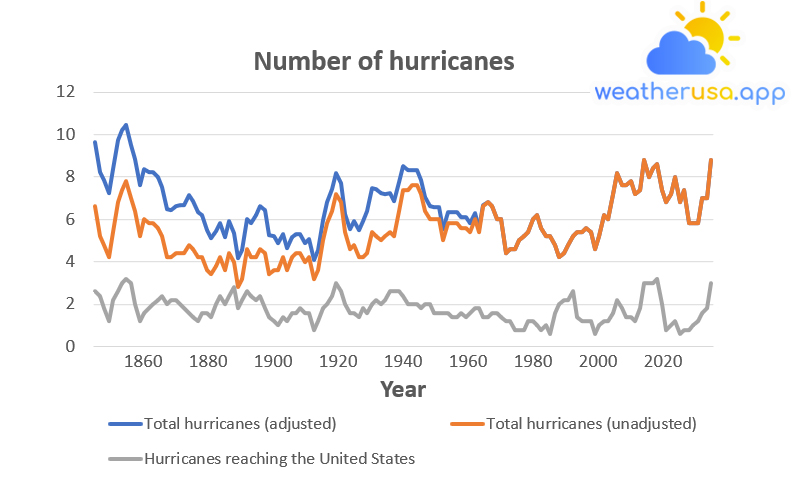
This chart shows the number of hurricanes that formed in the North Atlantic Ocean each year from 1878 to 2020, along with the number that made landfall in the United States.
The orange curve shows how the total in the green turn can be adjusted to try to account for the lack of aircraft and satellite observations in the early years. All three curves were smoothed using a five-year average plotted in the middle year. The most recent standard was devised in 2018.
| Year | Total hurricanes (adjusted) | Total hurricanes (unadjusted) | Hurricanes reaching the United States |
| 1880 | 9.63874 | 6.6 | 2.6 |
| 1881 | 8.24872 | 5.2 | 2.4 |
| 1882 | 7.82772 | 4.8 | 1.8 |
| 1883 | 7.23736 | 4.2 | 1.2 |
| 1884 | 8.38944 | 5.4 | 2.2 |
| 1885 | 9.7223 | 6.8 | 2.6 |
| 1886 | 10.20804 | 7.4 | 3 |
| 1887 | 10.43916 | 7.8 | 3.2 |
| 1888 | 9.49582 | 7 | 3 |
| 1889 | 8.84482 | 6.4 | 2 |
| 1890 | 7.589 | 5.2 | 1.2 |
| 1891 | 8.3433 | 6 | 1.6 |
| 1892 | 8.21306 | 5.8 | 1.8 |
| 1893 | 8.23152 | 5.8 | 2 |
| 1894 | 7.97938 | 5.6 | 2.2 |
| 1895 | 7.5356 | 5.2 | 2.4 |
| 1896 | 6.46862 | 4.2 | 2 |
| 1897 | 6.43264 | 4.2 | 2.2 |
| 1898 | 6.62844 | 4.4 | 2.2 |
| 1899 | 6.66464 | 4.4 | 2 |
| 1900 | 6.67938 | 4.4 | 1.8 |
| 1901 | 7.14486 | 4.8 | 1.6 |
| 1902 | 6.87034 | 4.6 | 1.4 |
| 1903 | 6.33056 | 4.2 | 1.2 |
| 1904 | 6.19772 | 4.2 | 1.6 |
| 1905 | 5.47598 | 3.6 | 1.6 |
| 1906 | 5.13668 | 3.4 | 1.4 |
| 1907 | 5.4591 | 3.8 | 2 |
| 1908 | 5.81044 | 4.2 | 2.4 |
| 1909 | 5.15556 | 3.6 | 2 |
| 1910 | 5.8964 | 4.4 | 2.4 |
| 1911 | 5.36032 | 4 | 2.8 |
| 1912 | 4.1679 | 2.8 | 1.8 |
| 1913 | 4.55718 | 3.2 | 2.2 |
| 1914 | 6.0257 | 4.6 | 2.6 |
| 1915 | 5.84202 | 4.2 | 2.4 |
| 1916 | 6.1842 | 4.2 | 2.2 |
| 1917 | 6.62338 | 4.6 | 2.4 |
| 1918 | 6.4119 | 4.4 | 1.8 |
| 1919 | 5.26592 | 3.4 | 1.4 |
| 1920 | 5.20796 | 3.6 | 1.2 |
| 1921 | 4.87144 | 3.6 | 1 |
| 1922 | 5.30032 | 4.2 | 1.4 |
| 1923 | 4.62592 | 3.6 | 1.2 |
| 1924 | 5.17576 | 4.2 | 1.6 |
| 1925 | 5.32514 | 4.4 | 1.6 |
| 1926 | 5.3125 | 4.4 | 1.8 |
| 1927 | 4.89324 | 4 | 1.6 |
| 1928 | 5.06812 | 4.2 | 1.6 |
| 1929 | 4.08822 | 3.2 | 0.8 |
| 1930 | 4.54568 | 3.6 | 1.2 |
| 1931 | 5.97882 | 5 | 1.8 |
| 1932 | 6.8203 | 5.8 | 2 |
| 1933 | 7.42614 | 6.4 | 2.4 |
| 1934 | 8.199 | 7.2 | 3 |
| 1935 | 7.72284 | 6.8 | 2.6 |
| 1936 | 6.26074 | 5.4 | 2 |
| 1937 | 5.5374 | 4.6 | 1.6 |
| 1938 | 5.90118 | 4.8 | 1.6 |
| 1939 | 5.49464 | 4.2 | 1.4 |
| 1940 | 5.91232 | 4.2 | 1.8 |
| 1941 | 6.40042 | 4.4 | 1.6 |
| 1942 | 7.47134 | 5.4 | 2 |
| 1943 | 7.41478 | 5.2 | 2.2 |
| 1944 | 7.2462 | 5 | 2 |
| 1945 | 7.2019 | 5.2 | 2.2 |
| 1946 | 7.25388 | 5.4 | 2.6 |
| 1947 | 6.86364 | 5.2 | 2.6 |
| 1948 | 7.75086 | 6.4 | 2.6 |
| 1949 | 8.49848 | 7.4 | 2.4 |
| 1950 | 8.302 | 7.4 | 2 |
| 1951 | 8.34138 | 7.6 | 2 |
| 1952 | 8.30516 | 7.6 | 2 |
| 1953 | 7.86162 | 7.2 | 1.8 |
| 1954 | 7.03774 | 6.4 | 2 |
| 1955 | 6.60828 | 6 | 2 |
| 1956 | 6.58736 | 6 | 1.6 |
| 1957 | 6.56382 | 6 | 1.6 |
| 1958 | 5.53962 | 5 | 1.6 |
| 1959 | 6.32076 | 5.8 | 1.6 |
| 1960 | 6.32586 | 5.8 | 1.4 |
| 1961 | 6.32194 | 5.8 | 1.4 |
| 1962 | 6.10684 | 5.6 | 1.6 |
| 1963 | 6.09758 | 5.6 | 1.4 |
| 1964 | 5.79868 | 5.4 | 1.6 |
| 1965 | 6.28954 | 6 | 1.8 |
| 1966 | 5.58426 | 5.4 | 1.8 |
| 1967 | 6.693 | 6.6 | 1.4 |
| 1968 | 6.8 | 6.8 | 1.4 |
| 1969 | 6.6 | 6.6 | 1.6 |
| 1970 | 6 | 6 | 1.6 |
| 1971 | 6 | 6 | 1.4 |
| 1972 | 4.4 | 4.4 | 1.2 |
| 1973 | 4.6 | 4.6 | 1.2 |
| 1974 | 4.6 | 4.6 | 0.8 |
| 1975 | 5 | 5 | 0.8 |
| 1976 | 5.2 | 5.2 | 0.8 |
| 1977 | 5.4 | 5.4 | 1.2 |
| 1978 | 6 | 6 | 1.2 |
| 1979 | 6.2 | 6.2 | 1 |
| 1980 | 5.6 | 5.6 | 0.8 |
| 1981 | 5.2 | 5.2 | 1 |
| 1982 | 5.2 | 5.2 | 0.6 |
| 1983 | 4.8 | 4.8 | 1.6 |
| 1984 | 4.2 | 4.2 | 2 |
| 1985 | 4.4 | 4.4 | 2.2 |
| 1986 | 4.8 | 4.8 | 2.2 |
| 1987 | 5.2 | 5.2 | 2.6 |
| 1988 | 5.4 | 5.4 | 1.4 |
| 1989 | 5.4 | 5.4 | 1.2 |
| 1990 | 5.6 | 5.6 | 1.2 |
| 1991 | 5.4 | 5.4 | 1.2 |
| 1992 | 4.6 | 4.6 | 0.6 |
| 1993 | 5.2 | 5.2 | 1 |
| 1994 | 6.2 | 6.2 | 1.2 |
| 1995 | 6 | 6 | 1.2 |
| 1996 | 7.2 | 7.2 | 1.6 |
| 1997 | 8.2 | 8.2 | 2.2 |
| 1998 | 7.6 | 7.6 | 1.8 |
| 1999 | 7.6 | 7.6 | 1.4 |
| 2000 | 7.8 | 7.8 | 1.4 |
| 2001 | 7.2 | 7.2 | 1.2 |
| 2002 | 7.4 | 7.4 | 1.8 |
| 2003 | 8.8 | 8.8 | 3 |
| 2004 | 8 | 8 | 3 |
| 2005 | 8.4 | 8.4 | 3 |
| 2006 | 8.6 | 8.6 | 3.2 |
| 2007 | 7.4 | 7.4 | 2 |
| 2008 | 6.8 | 6.8 | 0.8 |
| 2009 | 7.2 | 7.2 | 1 |
| 2010 | 8 | 8 | 1.2 |
| 2011 | 6.8 | 6.8 | 0.6 |
| 2012 | 7.4 | 7.4 | 0.8 |
| 2013 | 5.8 | 5.8 | 0.8 |
| 2014 | 5.8 | 5.8 | 1 |
| 2015 | 5.8 | 5.8 | 1.2 |
| 2016 | 7 | 7 | 1.6 |
| 2017 | 7 | 7 | 1.8 |
| 2018 | 8.8 | 8.8 | 3 |
Figure 1. Number of Hurricanes in the North Atlantic, 1878–2020
Data source: NOAA, 2021; Vecchi and Knutson, 2011
Web update: April 2021
Units: Number of hurricanes
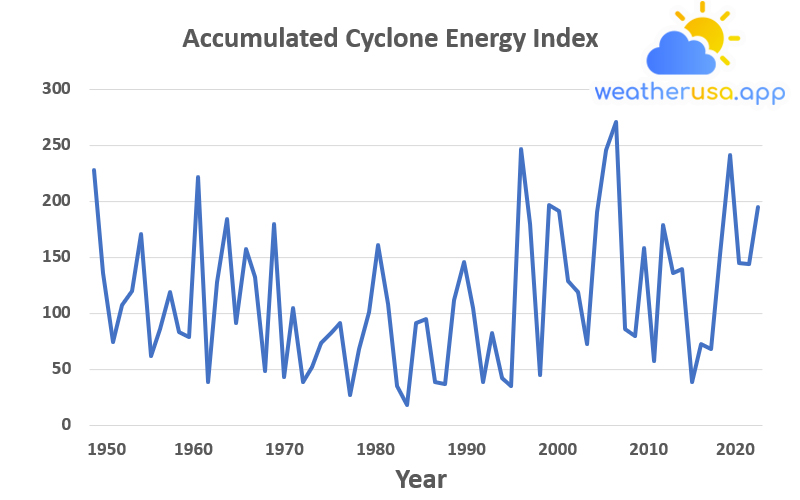
The National Oceanic and Atmospheric Administration defined “near normal,” “above normal,” and “below normal” ranges based on the distribution values of the ACE Index for 30 years from 1981 to 2010.
| Year | Adjusted ACE Index (as % of 1981-2010 median) |
| 1950 | 228.1081 |
| 1951 | 136.2162 |
| 1952 | 74.59459 |
| 1953 | 107.027 |
| 1954 | 120 |
| 1955 | 170.8108 |
| 1956 | 61.62162 |
| 1957 | 85.40541 |
| 1958 | 118.9189 |
| 1959 | 83.24324 |
| 1960 | 78.91892 |
| 1961 | 221.6216 |
| 1962 | 38.91892 |
| 1963 | 127.5676 |
| 1964 | 183.7838 |
| 1965 | 90.81081 |
| 1966 | 156.7568 |
| 1967 | 131.8919 |
| 1968 | 48.64865 |
| 1969 | 179.4595 |
| 1970 | 43.24324 |
| 1971 | 104.8649 |
| 1972 | 38.91892 |
| 1973 | 51.89189 |
| 1974 | 73.51351 |
| 1975 | 82.16216 |
| 1976 | 90.81081 |
| 1977 | 27.02703 |
| 1978 | 68.10811 |
| 1979 | 100.5405 |
| 1980 | 161.0811 |
| 1981 | 108.1081 |
| 1982 | 34.59459 |
| 1983 | 18.37838 |
| 1984 | 90.81081 |
| 1985 | 95.13514 |
| 1986 | 38.91892 |
| 1987 | 36.75676 |
| 1988 | 111.3514 |
| 1989 | 145.9459 |
| 1990 | 104.8649 |
| 1991 | 38.91892 |
| 1992 | 82.16216 |
| 1993 | 42.16216 |
| 1994 | 34.59459 |
| 1995 | 246.4865 |
| 1996 | 179.4595 |
| 1997 | 44.32432 |
| 1998 | 196.7568 |
| 1999 | 191.3514 |
| 2000 | 128.6486 |
| 2001 | 118.9189 |
| 2002 | 72.43243 |
| 2003 | 190.2703 |
| 2004 | 245.4054 |
| 2005 | 270.2703 |
| 2006 | 85.40541 |
| 2007 | 80 |
| 2008 | 157.8378 |
| 2009 | 57.2973 |
| 2010 | 178.3784 |
| 2011 | 136.2162 |
| 2012 | 139.4595 |
| 2013 | 38.91892 |
| 2014 | 72.43243 |
| 2015 | 68.10811 |
| 2016 | 152.4324 |
| 2017 | 241.0811 |
| 2018 | 144.8649 |
| 2019 | 143.7838 |
| 2020 | 194.5946 |
Figure 2. North Atlantic Tropical Cyclone Activity According to the Accumulated Cyclone Energy Index, 1950–2020
Data source: NOAA, 2021
Web update: April 2021
Units: Accumulated Cyclone Energy index
Figure 3. North Atlantic Tropical Cyclone Activity According to the Power Dissipation Index, 1949–2019
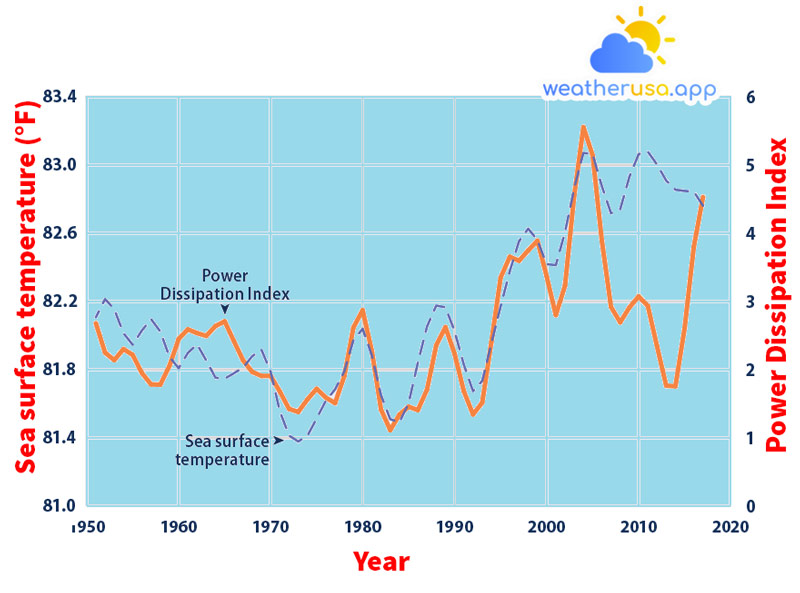
Note that sea surface temperature is measured in different units, but the values have been plotted along with the PDI to see how they compare. The lines have been smoothed using a five-year weighted average planned in the middle year. The most recent standard was scheduled in 2017.
| Year | Smoothed SST (F) | Smoothed Power Dissipation Index (10^11 m^3/s^2) |
| 1949 | ||
| 1950 | ||
| 1951 | 82.1066 | 2.6784 |
| 1952 | 82.21388 | 2.249 |
| 1953 | 82.15412 | 2.1383 |
| 1954 | 82.01354 | 2.3011 |
| 1955 | 81.9455 | 2.2156 |
| 1956 | 82.02902 | 1.9505 |
| 1957 | 82.09598 | 1.783 |
| 1958 | 82.02362 | 1.778 |
| 1959 | 81.87494 | 2.0556 |
| 1960 | 81.8078 | 2.4492 |
| 1961 | 81.8978 | 2.5897 |
| 1962 | 81.9482 | 2.5354 |
| 1963 | 81.85316 | 2.4939 |
| 1964 | 81.75254 | 2.6379 |
| 1965 | 81.7466 | 2.7074 |
| 1966 | 81.77846 | 2.419 |
| 1967 | 81.81104 | 2.1363 |
| 1968 | 81.87872 | 1.9656 |
| 1969 | 81.91652 | 1.9072 |
| 1970 | 81.78728 | 1.9082 |
| 1971 | 81.55508 | 1.6771 |
| 1972 | 81.4136 | 1.424 |
| 1973 | 81.37796 | 1.3788 |
| 1974 | 81.41198 | 1.5631 |
| 1975 | 81.51332 | 1.718 |
| 1976 | 81.61736 | 1.5895 |
| 1977 | 81.68396 | 1.5082 |
| 1978 | 81.78962 | 1.9018 |
| 1979 | 81.97178 | 2.6182 |
| 1980 | 82.03964 | 2.8708 |
| 1981 | 81.88304 | 2.2747 |
| 1982 | 81.6503 | 1.4132 |
| 1983 | 81.50918 | 1.1123 |
| 1984 | 81.4901 | 1.3397 |
| 1985 | 81.60332 | 1.4556 |
| 1986 | 81.84002 | 1.4057 |
| 1987 | 82.05314 | 1.7075 |
| 1988 | 82.17536 | 2.3569 |
| 1989 | 82.16564 | 2.6223 |
| 1990 | 82.02452 | 2.2292 |
| 1991 | 81.82904 | 1.6827 |
| 1992 | 81.67334 | 1.3428 |
| 1993 | 81.734 | 1.5155 |
| 1994 | 81.95414 | 2.4098 |
| 1995 | 82.17032 | 3.3501 |
| 1996 | 82.37804 | 3.654 |
| 1997 | 82.553 | 3.5959 |
| 1998 | 82.6268 | 3.7471 |
| 1999 | 82.55858 | 3.8891 |
| 2000 | 82.41872 | 3.3709 |
| 2001 | 82.41242 | 2.7995 |
| 2002 | 82.60628 | 3.231 |
| 2003 | 82.86494 | 4.5551 |
| 2004 | 83.07068 | 5.5545 |
| 2005 | 83.06402 | 5.1439 |
| 2006 | 82.87646 | 3.8943 |
| 2007 | 82.71716 | 2.9178 |
| 2008 | 82.74092 | 2.6936 |
| 2009 | 82.93082 | 2.911 |
| 2010 | 83.06348 | 3.0732 |
| 2011 | 83.07806 | 2.9344 |
| 2012 | 83.00318 | 2.342 |
| 2013 | 82.9085 | 1.7643 |
| 2014 | 82.85504 | 1.7555 |
| 2015 | 82.84784 | 2.6053 |
| 2016 | 82.8437 | 3.8005 |
| 2017 | 82.7609 | 4.53 |
| 2018 | ||
| 2019 |
Figure 3. North Atlantic Tropical Cyclone Activity According to the Power Dissipation Index, 1949–2019
Data source: Emanuel, 2021
Web update: April 2021
Units: °F; Power Dissipation Index
Key Points
- Since 1878, about six to seven hurricanes have formed in the North Atlantic each year. About two a year come ashore in the United States.
The total number of storms and the number making landfall in the United States do not indicate a clear overall trend since 1878 (see Figure 1). - According to the ACE Annual Total Index, cyclone intensity has increased noticeably over the past 20 years, and eight of the ten most active years since 1950 have occurred since the mid-1990s (see Figure 2).
Relatively high levels of cyclone activity were also observed during the 1950s and 1960s. - The PDI (see Figure 3) shows fluctuating cyclone intensity for most of the mid to late 20th century, followed by a noticeable increase since 1995.
These trends are compared with associated sea surface temperature variations in the tropical North Atlantic (see Figure 3). - Despite the apparent increase in tropical cyclone activity in recent years, as shown in Figures 2 and 3, changes in observational methods over time make it difficult to determine whether low storm activity has increased over time.
Background
- Hurricanes, tropical storms, and other intense rotating storms fall into a general category called cyclones. There are two main types of cyclones: tropical and extratropical.
Tropical cyclones gain energy from warm tropical oceans. Extratropical cyclones gain power from the jet stream and temperature differences between cold, dry air masses from higher latitudes and warm, moist air masses from lower margins.
- This indicator focuses on tropical cyclones in the Atlantic, Caribbean, and Gulf of Mexico. Tropical cyclones are most common during the “hurricane season,” which runs from June to November.
The effects of tropical cyclones are numerous and well-known. At sea, storms disrupt and threaten ships. When hurricanes make landfall, heavy rains and strong winds can cause severe property damage, loss of life, soil erosion, and flooding.
The associated storm surge—a large volume of ocean water pushed ashore by a cyclone’s strong winds—can cause severe flooding, erosion, and destruction.
- Climate change is expected to affect tropical cyclones by increasing sea surface temperatures, a key factor influencing cyclone formation and behavior.
The US Global Change Research Program and the Intergovernmental Panel on Climate Change project that tropical cyclones will become more intense with higher wind speeds and heavier rainfall during the 21st century.
About the indicator
- Records of tropical cyclones in the Atlantic Ocean have been collected since the 1800s. The most reliable long-term papers focus on hurricanes, the strongest category of tropical cyclones in the Atlantic, with winds of at least 74 miles per hour.
This indicator uses historical data from the National Oceanic and Atmospheric Administration to track the number of hurricanes per year in the North Atlantic and the number that have hit the United States since 1878.
Some storms over the ocean may have disappeared before airplanes and satellites were launched observations. Hence, scientists used other evidence, such as shipping records, to estimate the number of hurricanes that may have formed in earlier years.
- This indicator also looks at the Cyclone Accumulated Energy Index and the Energy Dissipation Index, two ways of monitoring tropical cyclones’ frequency, strength, and duration based on wind speed measurements.
- Each cyclone has an ACE Index value based on the maximum wind speed measured at six-hour intervals for the entire hurricane is classified as at least a tropical storm.
Therefore, the ACE Index value of a storm corresponds to both strength and duration. The National Oceanic and Atmospheric Administration calculates the total ACE index value for the entire hurricane season by summing the values for all named storms, including subtropical storms, tropical storms, and hurricanes. The resulting annual sum corresponds to the cyclone’s strength, duration, and frequency.
For this indicator, the index has been converted to a scale where 100 equals the mean value for the base period from 1981 to 2010. The thresholds in Figure 2 define whether the ACE index for a given year is close to normal or significantly above average.
- Like the ACE Index, the PDI is based on wind speed measurements but uses a different calculation method that puts more emphasis on storm intensity.
This indicator shows the annual PDI value, the sum of the PDI values for all named storms during the year.
About the Data
Notes on the indicator
Over time, data collection methods have changed as technology has improved. For example, wind speed collection methods have evolved substantially over the past 60 years, while aircraft surveys began in 1944 and satellite tracking around 1966.
Figure 1 shows how older hurricane counts have been adjusted to account for the lack of aircraft and satellite observations. Changes in data collection technologies could substantially affect the overall patterns in Figures 2 and 3.
The effects of these changes on data consistency over the lifetime of the indicator would benefit from further research.
The reason for the recent divergence between cyclone activity and sea surface temperature in Figure 3 has not been conclusively identified. Still, it may be related to other factors that influence storm formation, such as the difference in wind speeds at different levels in the atmosphere.
Data Sources
Kerry Emanuel of the Massachusetts Institute of Technology calculated the values for Figure 3. The ACE index and the PDI are based on wind speed measurements compiled by the National Oceanic and Atmospheric Administration.

Weather 01852 - Lowell MA

49°
overcast clouds
Feels like 47°05:32/19:50
51°F
/47°F
82%
1016 hPa
7 mi
4.61 mph


