Temperature and Drought in the Southwest
A Closer Look: Temperature and Drought in the Southwest
This feature provides a closer look at temperature and drought trends in the southwestern United States.
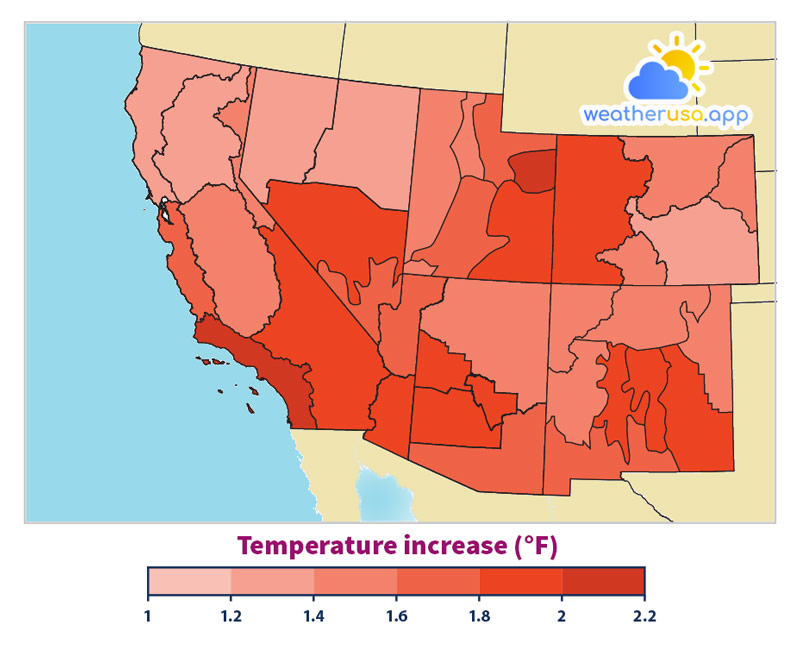
Figure 1. Average Temperatures in the Southwestern United States, 2000–2020 Versus Long-Term Average

This map shows how the average air temperature from 2000 to 2020 has differed from the long-term average. To provide more detailed information, each state has been divided into climate divisions, which are zones that share similar climate features.
| Climate Division ID | T Anomaly |
| 201 | 1.678439 |
| 202 | 1.592989 |
| 203 | 1.869312 |
| 204 | 1.947751 |
| 205 | 1.958532 |
| 206 | 1.994577 |
| 207 | 1.631548 |
| 401 | 1.340741 |
| 402 | 1.258267 |
| 403 | 1.416931 |
| 404 | 1.68459 |
| 405 | 1.569709 |
| 406 | 2.101058 |
| 407 | 1.84623 |
| 501 | 1.343651 |
| 502 | 1.893783 |
| 503 | 1.560317 |
| 504 | 1.499339 |
| 505 | 1.501521 |
| 2601 | 1.33254 |
| 2602 | 1.333267 |
| 2603 | 1.927513 |
| 2604 | 1.770899 |
| 2901 | 1.533003 |
| 2902 | 1.466336 |
| 2903 | 1.546362 |
| 2904 | 1.517659 |
| 2905 | 1.803439 |
| 2906 | 1.849206 |
| 2907 | 1.865079 |
| 2908 | 1.710847 |
| 4201 | 1.41832 |
| 4202 | 1.531415 |
| 4203 | 1.503042 |
| 4204 | 1.641336 |
| 4205 | 1.655159 |
| 4206 | 2.066799 |
| 4207 | 1.926124 |
Figure 1. Average Temperatures in the Southwestern United States, 2000-2020 Versus Long-Term Average
Data source: NOAA, 2021
Web update: April 2021
Units: °F
Figure 2. Southwestern US land in drought conditions, 2000–2020
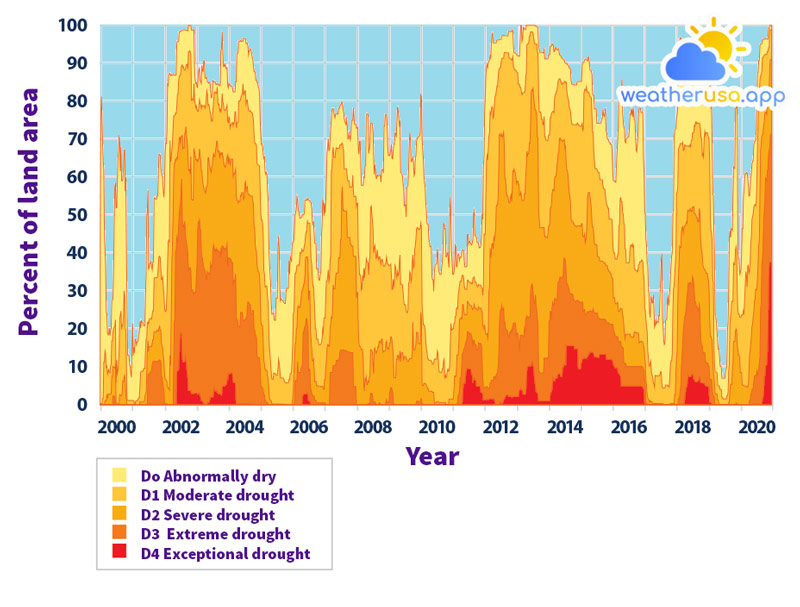
This graph shows the percentage of land area in six southwestern states classified as drought conditions from 2000 to 2020.
This figure uses the US Drought Monitor classification system, which is described in the table in the Drought indicator.
Figure 3. Drought Severity in the Southwestern United States, 1895–2020
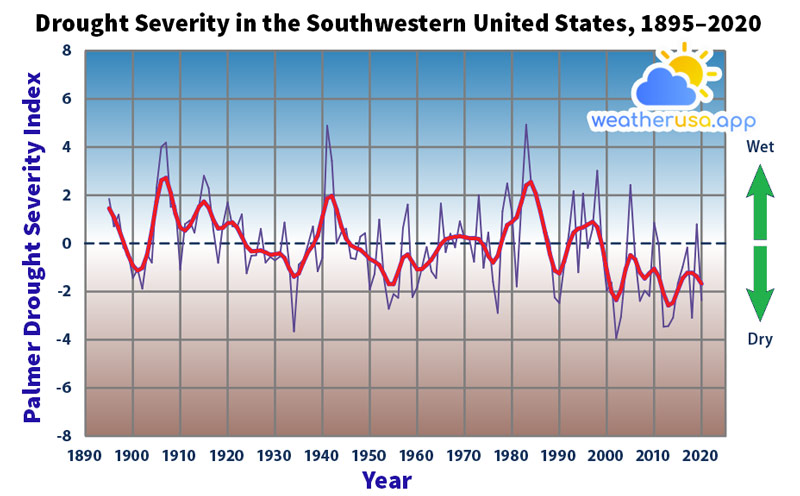
This graph shows annual Palmer Drought Severity Index values, averaged over six states in the Southwest. Positive values represent wetter-than-average conditions, while negative values represent drier-than-average conditions.
A value between -2 and -3 indicates moderate drought, -3 to -4 severe drought, and -4 or lower indicates extreme drought. The thicker line is the nine-year weighted average.
A value between -2 and -3 indicates moderate drought, -3 to -4 severe drought, and -4 or lower indicates extreme drought. The thicker line is the nine-year weighted average.
| Year | Annual avg | 9-yr avg |
| 1895 | 1.849027 | 1.454559 |
| 1896 | 0.704427 | 1.08735 |
| 1897 | 1.191038 | 0.615365 |
| 1898 | -0.1779 | 0.068471 |
| 1899 | -0.39817 | -0.48127 |
| 1900 | -1.43943 | -0.91824 |
| 1901 | -1.0748 | -1.12975 |
| 1902 | -1.8819 | -1.01743 |
| 1903 | -0.44792 | -0.47773 |
| 1904 | -0.79754 | 0.520729 |
| 1905 | 2.316924 | 1.735053 |
| 1906 | 4.006448 | 2.620259 |
| 1907 | 4.187675 | 2.719562 |
| 1908 | 1.519302 | 2.088573 |
| 1909 | 1.552336 | 1.230651 |
| 1910 | -1.08543 | 0.654565 |
| 1911 | 0.801013 | 0.532024 |
| 1912 | 0.948632 | 0.738068 |
| 1913 | 0.445492 | 1.116917 |
| 1914 | 1.587472 | 1.533911 |
| 1915 | 2.80687 | 1.733289 |
| 1916 | 2.286936 | 1.490974 |
| 1917 | 0.539478 | 0.969758 |
| 1918 | -0.80849 | 0.621108 |
| 1919 | 0.772883 | 0.65229 |
| 1920 | 1.701148 | 0.835784 |
| 1921 | 0.713799 | 0.870428 |
| 1922 | 0.686291 | 0.66196 |
| 1923 | 1.210943 | 0.274798 |
| 1924 | -1.24266 | -0.12064 |
| 1925 | -0.51045 | -0.32344 |
| 1926 | -0.49276 | -0.31697 |
| 1927 | 0.605195 | -0.29249 |
| 1928 | -0.79694 | -0.37457 |
| 1929 | -0.56495 | -0.47047 |
| 1930 | -0.70299 | -0.45322 |
| 1931 | -0.5523 | -0.41154 |
| 1932 | 0.867048 | -0.60023 |
| 1933 | -0.86314 | -1.04849 |
| 1934 | -3.65509 | -1.37934 |
| 1935 | -0.88246 | -1.24517 |
| 1936 | -0.68494 | -0.77025 |
| 1937 | -0.02268 | -0.34263 |
| 1938 | 0.703698 | -0.08234 |
| 1939 | -1.15948 | 0.319956 |
| 1940 | -0.59787 | 1.10122 |
| 1941 | 4.884364 | 1.866003 |
| 1942 | 3.421335 | 1.973864 |
| 1943 | 0.009883 | 1.407214 |
| 1944 | 0.455919 | 0.699373 |
| 1945 | 0.611597 | 0.200299 |
| 1946 | -0.60812 | -0.07464 |
| 1947 | -0.65078 | -0.18608 |
| 1948 | 0.281362 | -0.26199 |
| 1949 | 0.427246 | -0.44028 |
| 1950 | -1.90733 | -0.64605 |
| 1951 | -1.26909 | -0.74918 |
| 1952 | 0.990164 | -0.89556 |
| 1953 | -1.47573 | -1.27626 |
| 1954 | -2.71615 | -1.68583 |
| 1955 | -2.10567 | -1.68803 |
| 1956 | -2.26007 | -1.17825 |
| 1957 | 0.640011 | -0.59207 |
| 1958 | 1.613652 | -0.46116 |
| 1959 | -2.23071 | -0.78272 |
| 1960 | -1.81776 | -1.07596 |
| 1961 | -1.00495 | -1.06293 |
| 1962 | -0.15353 | -0.88601 |
| 1963 | -1.16324 | -0.67135 |
| 1964 | -1.44346 | -0.36965 |
| 1965 | 1.65704 | -0.0354 |
| 1966 | -0.362 | 0.168019 |
| 1967 | 0.40188 | 0.233442 |
| 1968 | -0.16445 | 0.274253 |
| 1969 | 0.917798 | 0.301037 |
| 1970 | 0.191916 | 0.263611 |
| 1971 | 0.191053 | 0.213655 |
| 1972 | -0.76038 | 0.21754 |
| 1973 | 2.0015 | 0.177439 |
| 1974 | -1.01519 | -0.07747 |
| 1975 | 0.450556 | -0.51733 |
| 1976 | -1.59715 | -0.7942 |
| 1977 | -2.88982 | -0.5195 |
| 1978 | 1.32384 | 0.199699 |
| 1979 | 2.489501 | 0.76001 |
| 1980 | 1.273309 | 0.894993 |
| 1981 | -1.78798 | 1.08263 |
| 1982 | 1.654211 | 1.718084 |
| 1983 | 4.928407 | 2.409097 |
| 1984 | 2.604381 | 2.54667 |
| 1985 | 2.133221 | 2.075625 |
| 1986 | 1.289717 | 1.315849 |
| 1987 | 0.598719 | 0.453349 |
| 1988 | 0.000478 | -0.4409 |
| 1989 | -2.2439 | -1.12414 |
| 1990 | -2.47781 | -1.24566 |
| 1991 | -0.9459 | -0.75042 |
| 1992 | 0.390576 | -0.03403 |
| 1993 | 2.169748 | 0.44906 |
| 1994 | -1.20071 | 0.611761 |
| 1995 | 2.069136 | 0.665522 |
| 1996 | -0.19144 | 0.785423 |
| 1997 | 0.591696 | 0.893114 |
| 1998 | 3.018517 | 0.67969 |
| 1999 | -0.15298 | -0.05649 |
| 2000 | -1.96089 | -1.10758 |
| 2001 | -1.62713 | -2.01229 |
| 2002 | -3.93348 | -2.34964 |
| 2003 | -3.05733 | -1.9297 |
| 2004 | -1.05479 | -1.06309 |
| 2005 | 2.426283 | -0.49339 |
| 2006 | -0.59901 | -0.66201 |
| 2007 | -2.39049 | -1.20632 |
| 2008 | -1.96468 | -1.45387 |
| 2009 | -2.18352 | -1.24052 |
| 2010 | 0.85808 | -1.05107 |
| 2011 | -0.08337 | -1.38006 |
| 2012 | -3.46147 | -2.09045 |
| 2013 | -3.43208 | -2.57374 |
| 2014 | -3.08341 | -2.45951 |
| 2015 | -1.65772 | -1.93939 |
| 2016 | -0.9844 | -1.45011 |
| 2017 | -0.173 | -1.22599 |
| 2018 | -3.09029 | -1.22209 |
| 2019 | 0.792746 | -1.37285 |
| 2020 | -2.3603 | -1.67669 |
Figure 3. Drought Severity in the Southwestern United States, 1895-2020
Data source: NOAA, 2021
Web update: April 2021
Units: Palmer Drought Severity Index
Key Points
- Every part of the Southwest experienced warmer average temperatures than the long-term average between 2000 and 2020. Some areas were more than 2°F warmer than average (see Figure 1).
- Large parts of the Southwest have experienced drought since weekly drought monitoring records began in 2000.
For long periods from 2002 to 2005 and from 2012 to 2020, nearly the entire region was abnormally dry or even drier (see Figure 2). - Based on the long-term Palmer index, drought conditions in the Southwest have varied since 1895. Since the early 20th century, the Southwest has experienced wetter conditions in three main periods: the 20th century, the 1940s, and the 1980s.
Drier conditions occurred in the 1920s/1930s in the 1950s, again in the 1950s, and since 1990, when the Southwest experienced some of the longest droughts on record (see Figure 3).
Background
- The American Southwest might conjure up images of a hot, dry landscape—a land of rocks, canyons, and sun-scorched deserts. In fact, much of this region has low annual rainfall and seasonally high temperatures that contribute to its characteristic desert climate.
Yet this landscape actually supports a vast array of plants and animals, along with the millions of people who call the Southwest home. All these plants, animals, and people need water to survive. - Water is already scarce in the Southwest, so every drop is a precious resource. People in the Southwest are particularly dependent on surface water supplies like Lake Mead, which are prone to evaporation.
Thus, even a small increase in temperature or decrease in precipitation in this already arid region can seriously threaten natural systems and society.
Droughts also contribute to increased pests and wildfires, which harm local economies and reduce the amount of water available for electricity generation—for example, at the Hoover Dam. - While the two indicators in this report present information on unusually high or low temperatures and drought nationwide, this feature highlights the Southwest because of its particular sensitivity to temperature and drought.
Parts of the Southwest are also experiencing long-term reductions in mountain snowpack, which makes up much of the region’s water supply. This feature focuses on six states that are commonly considered “Southwestern” and that are characterized at least in part by arid landscapes and insufficient water supplies: Arizona, California, Colorado, Nevada, New Mexico, and Utah.
Temperature and drought data come from a network of thousands of weather stations overseen by the National Weather Service. - The map in Figure 1 shows how mean annual temperatures in the Southwest between 2000 and 2020 have differed from the mean over the entire period since extensive temperature records have been available.
- Figures 2 and 3 show two ways of measuring drought in the Southwest: the Drought Monitor and the Palmer Drought Severity Index. The Palmer index is calculated from precipitation and temperature measurements at meteorological stations and has been widely used for many years.
The Drought Monitor is a newer and more detailed index based on several other indices, along with other factors such as snow water content, water table, reservoir storage, pasture/mountain range conditions, and other impacts.
About the Data
Notes
Natural variability, changes in irrigation practices, and other diversions of water for human use can affect some drought-related measurements.
Soil moisture, groundwater, and streamflow are included in the drought monitoring calculations (Figure 2) and are all sensitive to human activities.
Soil moisture, groundwater, and streamflow are included in the drought monitoring calculations (Figure 2) and are all sensitive to human activities.
Data Sources
Data for Figures 1 and 3 were obtained from the National Center for Environmental Information of the National Oceanic and Atmospheric Administration. Data for Figure 2 is provided by the National Drought Mitigation Center.

Weather 01852 - Lowell MA

48°
overcast clouds
Feels like 46°05:32/19:50
50°F
/47°F
82%
1018 hPa
7 mi
4.61 mph


