Snow and Ice
Climate Change Indicators: Snow and Ice

Snow consists of individual ice crystals that grow while suspended in the atmosphere—usually in clouds—and then fall and accumulate on the ground, where they undergo further changes.
It consists of frozen crystalline water throughout its life cycle, starting when ice crystals form in the atmosphere under the right conditions, grow to millimeter size, precipitate and accumulate on surfaces, then metamorphose in place and finally melt, they slide or sublimate.
Ice is water frozen in a solid state, usually forming at temperatures of 0 degrees Celsius or 32°F or less.
Depending on the presence of impurities such as soil particles or air bubbles, it can appear transparent or bluish more or less opaque bluish-white color.
Climate Change Indicators: Snow and Ice
Climate change can dramatically alter the snow and ice-covered areas of the Earth because snow and ice can easily shift between solid and liquid states in response to relatively small changes in temperature.
This chapter focuses on trends in snow, glaciers, and the freezing and melting of oceans and lakes.
Why does it matter?
- Reduced snowfall and less snow cover on the ground can reduce the beneficial insulating effects of snow for vegetation and wildlife, while also affecting water resources, transportation, cultural practices, travel, and recreation for millions of people.
For communities in the Arctic, declining sea ice can threaten homes and property by increasing coastal erosion and exposure to storms, while melting ground can damage roads and buildings and accelerate erosion.
Conversely, reduced snow and ice may offer commercial opportunities for others, such as ice-free shipping routes and greater access to natural resources.
- Such changing climatic conditions can have worldwide implications, as snow and ice affect air temperatures, sea levels, ocean currents, and storm patterns.
For example, melting ice sheets in Greenland and Antarctica add fresh water to the ocean, raising sea levels and changing ocean circulation, possibly due to differences in temperature and salinity.
Because of their light colors, snow and ice also reflect sunlight more than open water or bare ground, so the reduction of snow cover and ice causes the Earth’s surface to absorb more energy from the sun and heat up.
Summary of Key Points
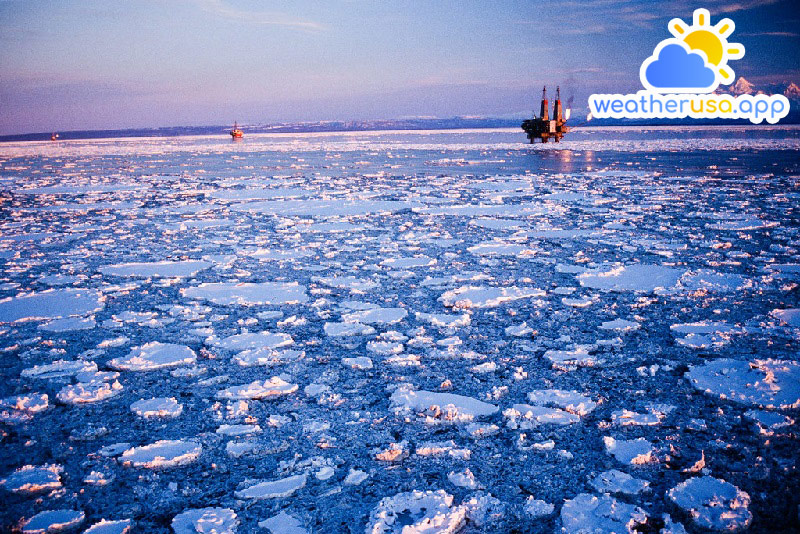
Arctic Sea Ice. Part of the Arctic Ocean is covered with ice throughout the year. The ice-covered area is typically the smallest in September, after the summer melt season.
The annual minimum size of Arctic sea ice has decreased over time, making it the 12th smallest ever recorded in September 2021. The length of the melting season for Arctic ice has increased, and the ice has also thinned, making it more vulnerable to further melting.
Antarctic Sea Ice. Antarctic sea ice coverage in September and February has increased slightly overall since 1979, although it has decreased over the past few years.
Slight increases in Antarctic sea ice outweigh the loss of Arctic sea ice over the same time period.
Ice Sheets. Since 1992, the giant ice sheets covering Greenland and Antarctica have each lost an average of more than 100 billion metric tons of ice per year.
The total amount of ice lost from 1992 to 2018 was enough to raise the sea levels worldwide by roughly seven-tenths on average. This corresponds to about a quarter of the total sea level rise observed over that time period.
Glaciers. Glaciers in the United States and around the world have generally shrunk since the 1960s, and the rate at which glaciers melt has accelerated over the past decade. Ice loss from glaciers has contributed to the observed rise in sea levels.
Arctic Glaciers. Rapid changes are occurring in the Arctic, where air temperatures are warming twice as fast as the global average temperature.
Seven of the eight Arctic glaciers with long-term measurements have lost ice continuously since the mid-20th century. The Arctic has been the dominant source of global sea level rise since at least 1972.
A Closer Look: Glacier National Park’s Glaciers. Glacier National Park in Montana attracts visitors from far and wide for its dramatic beauty and glaciers.
The total surface area of the 37 glaciers mentioned in Glacier National Park decreased by about 34 percent between 1966 and 2015. In 2015, each glacier was smaller than in 1966.
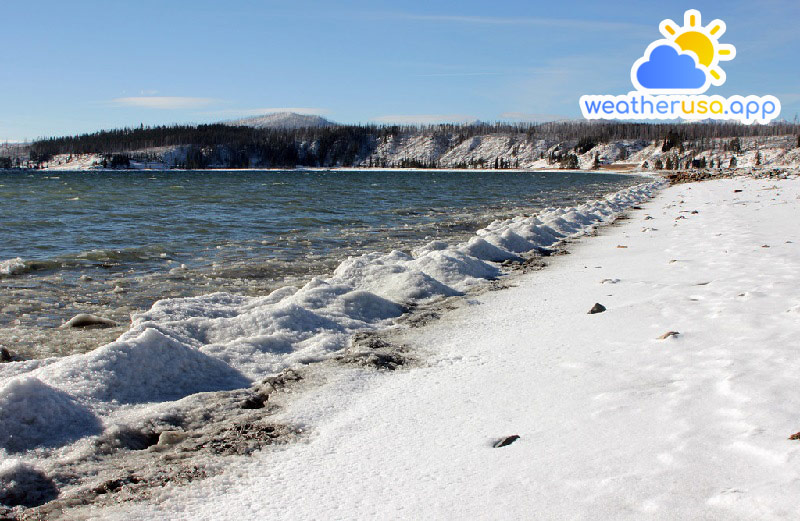
Lake Ice. Lakes in the northern United States freeze later and thaw sooner than in the 1800s and early 1900s. Freezing dates then slipped at the rate of roughly half a day to a day and a half per decade.
All of the lakes studied were also found to melt earlier in the year, with spring melt dates growing up to 24 days earlier in the last 114 years.
Great Lakes Ice Cover. Parts of the Great Lakes usually freeze every winter. Since the early 1970s, all five of the Great Lakes have experienced a long-term decrease in the maximum area that freezes each year, but the decrease is statistically significant in only one lake.
The number of frozen days per year has also decreased for all five lakes since the early 1970s.
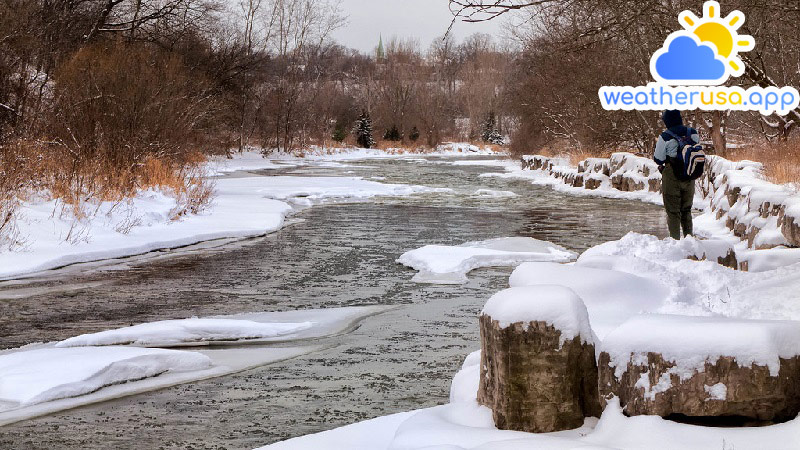
Community Connection: Ice Breaking on Three Alaskan Rivers. Regions in the far north are warming faster than other parts of the world.
Three long-running contests in Alaska’s Tanana, Yukon, and Kuskokwim rivers—where people predict when the river ice will break in the spring—provide a century of community-based evidence of what ice is in these rivers usually leaves earlier in the spring than before.
Snowfall. Total snowfall—the amount of snow falling at a given location—has declined in most parts of the country since widespread records began in 1930 form of rain instead of snow.
Snow Cover. Snow cover refers to the area of land covered with snow at any given time. Between 1972 and 2020, the average portion of North America covered with snow decreased at a rate of about 1,870 square miles per year, based on weekly measurements throughout the year.
However, there has been a lot of variability from year to year. The time that snow covers the ground has shortened by about two weeks, on average, since 1972.
Snowpack. In the early spring, snow on the ground decreased in 93 percent of the western United States between 1955 and 2022. During this time, snowdrifts decreased by an average of 23 percent at all sites.
Most sites have the highest snowpack early in the season, as higher temperatures cause the snow to melt earlier. Snowpack season length decreased on approximately 86 percent of the sites analyzed, with an average of more than 18 days.
Permafrost. Below about 80 percent of Alaska’s land is permafrost, which means icy rock or soil that stays frozen for two or more years. Between 1978 and 2020, permafrost temperatures increased in 14 of 15 long-term monitoring sites in Alaska.
Permafrost warmed the fastest in northern Alaska. These increases in permafrost temperatures are mostly due to long-term air temperatures and are consistent with changes observed in other parts of the Arctic.
Unfrozen days have generally increased in North America, with some variation by region.

Weather 01852 - Lowell MA

76°
few clouds
Feels like 75°05:31/19:51
80°F
/69°F
34%
1004 hPa
7 mi
4 mph


