Seasonal Temperature
Temperature
Temperature is a physical quantity that quantitatively expresses the perceptions of hot and cold. The temperature is measured with a thermometer.
Thermometers are calibrated in various temperature scales, which historically have relied on multiple reference points and thermometric substances for definition. The most common scales are the Celsius scale with the unit symbol °C (formerly called centigrade), the Fahrenheit scale (°F), and the Kelvin scale (K), the latter being mainly used for scientific purposes. The kelvin is one of the seven base units of the International System of Units (SI).
Absolute zero, i.e. zero kelvin or −273.15°C, is the lowest point on the thermodynamic temperature scale. Experimentally, it can only be approached very closely but not achieved, as recognized by the third law of thermodynamics. It would be impossible to extract energy in the form of heat from a body at this temperature.
Temperature is important in all areas of natural science, including physics, chemistry, earth science, astronomy, medicine, biology, ecology, materials science, metallurgy, engineering mechanics, and geography, as well as most aspects of daily life.
Climate Change Indicators: Seasonal Temperature
This indicator describes trends in average temperatures for each season across the United States.
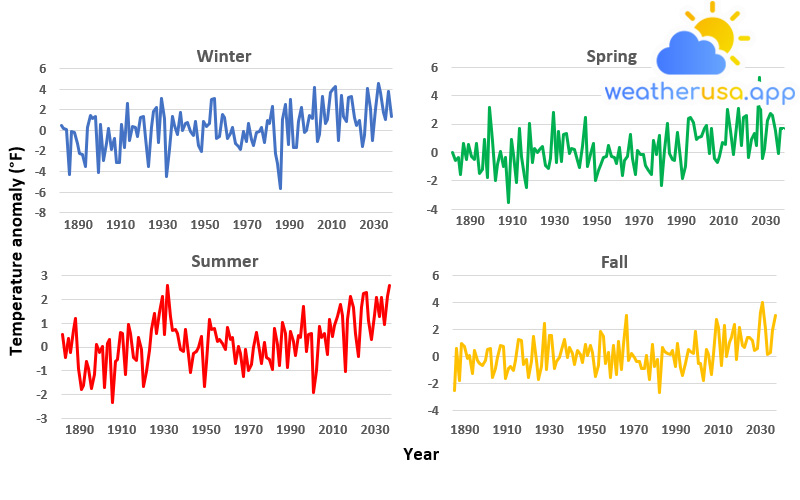
Figure 1. Average Seasonal Temperatures in the Contiguous 48 States, 1896–2021
 This figure shows the changes in average temperature for each season in the 48 contiguous states from 1896 to 2021. The seasons are defined as winter, spring, summer, and autumn. This chart uses the 1901–2000 average to depict change. Choosing a different reference period does not change the shape of the data over time.
| Year | Winter | Spring | Summer | Fall |
| 1896 | 0.51 | 0.02 | 0.55 | -2.49 |
| 1897 | 0.14 | -0.55 | -0.46 | 0.59 |
| 1898 | 0.04 | -0.33 | 0.38 | -1.77 |
| 1899 | -4.28 | -1.54 | -0.24 | 1.02 |
| 1900 | -0.07 | 0.62 | 0.7 | 0.79 |
| 1901 | -0.24 | -0.49 | 1.22 | -0.09 |
| 1902 | -1.23 | 0.55 | -0.91 | 0.07 |
| 1903 | -2.2 | -0.26 | -1.81 | -1.25 |
| 1904 | -2.34 | -0.47 | -1.62 | 0.46 |
| 1905 | -3.54 | 0.66 | -0.62 | -0.27 |
| 1906 | 0.29 | -1.45 | -0.89 | -0.47 |
| 1907 | 1.48 | -1.21 | -1.73 | -0.61 |
| 1908 | 1.16 | 0.91 | -1.14 | -0.26 |
| 1909 | 1.32 | -1.77 | 0.1 | 0.55 |
| 1910 | -4.06 | 3.17 | -0.23 | 0.59 |
| 1911 | 0.6 | 0.82 | 0.04 | -1.54 |
| 1912 | -2.88 | -1.98 | -1.71 | -0.85 |
| 1913 | -1.26 | -0.84 | 0.13 | -0.08 |
| 1914 | 0.22 | 0.06 | 0.31 | 0.86 |
| 1915 | -1.84 | -1.02 | -2.32 | 0.74 |
| 1916 | -0.76 | -0.35 | -0.6 | -1.59 |
| 1917 | -3.13 | -3.55 | -0.53 | -0.87 |
| 1918 | -3.12 | 0.94 | 0.63 | -0.68 |
| 1919 | 0.61 | -0.16 | 0.57 | -1.04 |
| 1920 | -1.66 | -2.13 | -1.17 | -0.29 |
| 1921 | 2.57 | 1.66 | 0.95 | 1.27 |
| 1922 | -0.95 | -0.28 | 0.58 | 1.17 |
| 1923 | 0.34 | -1.68 | -0.43 | -0.59 |
| 1924 | 0.25 | -2.47 | -0.55 | -0.18 |
| 1925 | -0.57 | 2.07 | 0.39 | -1.55 |
| 1926 | 1.26 | -0.68 | -0.1 | -0.38 |
| 1927 | 1.36 | 0.28 | -1.65 | 1.53 |
| 1928 | -0.72 | -0.02 | -1.02 | -0.24 |
| 1929 | -3.51 | 0.28 | -0.16 | -1.64 |
| 1930 | 0.3 | 0.43 | 0.72 | -0.71 |
| 1931 | 1.8 | -0.95 | 1.42 | 2.48 |
| 1932 | 2.21 | -1.1 | 0.57 | -0.96 |
| 1933 | -1.13 | -0.42 | 1.47 | 1.6 |
| 1934 | 3.05 | 2.82 | 2.13 | 1.57 |
| 1935 | 1.17 | -0.7 | 0.52 | -0.85 |
| 1936 | -4.45 | 1.45 | 2.6 | -0.33 |
| 1937 | -1.88 | -0.63 | 1.28 | -0.08 |
| 1938 | 1.38 | 1.28 | 0.69 | 0.78 |
| 1939 | 0.47 | 1.33 | 0.73 | 1.25 |
| 1940 | -0.43 | -0.05 | 0.56 | -0.07 |
| 1941 | 1.7 | 0.26 | -0.12 | 0.66 |
| 1942 | 0 | 0.23 | -0.18 | 0.25 |
| 1943 | 0.66 | -0.55 | 0.76 | -0.57 |
| 1944 | 0.81 | -1.09 | -0.32 | 0.46 |
| 1945 | -0.08 | 0.43 | -1.08 | 0.16 |
| 1946 | -0.45 | 2.46 | -0.29 | -0.41 |
| 1947 | 0.89 | -0.98 | -0.2 | 0.93 |
| 1948 | -1.42 | -0.15 | -0.04 | 0.07 |
| 1949 | -2.09 | 0.6 | 0.45 | 0.8 |
| 1950 | 0.85 | -1.94 | -1.68 | 0.32 |
| 1951 | 0.35 | -1.24 | -0.66 | -1.49 |
| 1952 | 0.67 | -0.94 | 1.16 | -0.63 |
| 1953 | 3.02 | -0.36 | 0.75 | 1.87 |
| 1954 | 3.1 | -0.25 | 0.77 | 1.51 |
| 1955 | -0.79 | 0.48 | 0.22 | -0.5 |
| 1956 | -0.57 | -0.29 | 0.3 | 0.31 |
| 1957 | 1.56 | -0.38 | 0.14 | -1.51 |
| 1958 | 1.3 | -0.8 | -0.12 | 0.84 |
| 1959 | -0.83 | 0.38 | 0.84 | -1.31 |
| 1960 | -0.26 | -1.65 | 0.33 | 1.1 |
| 1961 | 0.28 | -0.58 | 0.41 | -0.96 |
| 1962 | -1.24 | -0.26 | -0.7 | 0.94 |
| 1963 | -1.58 | 1.29 | 0.02 | 3.03 |
| 1964 | -1.83 | -0.4 | -0.27 | -0.28 |
| 1965 | -0.11 | -1.54 | -1.23 | 0.25 |
| 1966 | -1.07 | 0.13 | -0.11 | -0.02 |
| 1967 | 0.66 | -0.16 | -0.97 | -0.38 |
| 1968 | -0.92 | -0.15 | -0.75 | -0.32 |
| 1969 | -1.49 | -0.9 | -0.02 | -0.83 |
| 1970 | -0.25 | -1.25 | 0.63 | -0.83 |
| 1971 | -0.07 | -1.53 | -0.13 | 0.12 |
| 1972 | 0.26 | 0.87 | -0.71 | -1.66 |
| 1973 | -1.22 | -0.14 | 0.21 | 0.92 |
| 1974 | 0.92 | 1.18 | -0.44 | -0.69 |
| 1975 | 0.69 | -2.29 | -0.53 | -0.18 |
| 1976 | 2.36 | 0.15 | -0.95 | -2.66 |
| 1977 | -2.22 | 2.05 | 0.78 | 0.71 |
| 1978 | -3.19 | -0.04 | 0.11 | 0.36 |
| 1979 | -5.62 | -0.48 | -0.76 | 0.21 |
| 1980 | 1.1 | -0.56 | 1.03 | 0.16 |
| 1981 | 2.5 | 1.39 | 0.56 | 0.44 |
| 1982 | -1.41 | -0.43 | -0.86 | -0.74 |
| 1983 | 3.04 | -1.8 | 0.65 | 0.99 |
| 1984 | -1.67 | -1 | 0.24 | -0.79 |
| 1985 | -1.66 | 2.39 | -0.34 | -1.37 |
| 1986 | 0.88 | 2.46 | 0.48 | -0.51 |
| 1987 | 2.19 | 2.1 | 0.4 | 0.51 |
| 1988 | -0.22 | 0.89 | 1.71 | 0.4 |
| 1989 | 0.01 | 1.08 | -0.18 | 0.23 |
| 1990 | 1.41 | 1.12 | 0.52 | 1.87 |
| 1991 | 1.14 | 1.69 | 0.59 | -0.52 |
| 1992 | 4.12 | 1.88 | -1.9 | -0.46 |
| 1993 | -1.11 | -0.06 | -0.98 | -1.72 |
| 1994 | -0.43 | 1.69 | 0.86 | 0.56 |
| 1995 | 3.33 | -0.46 | 0.4 | 0.18 |
| 1996 | 0.71 | -0.7 | 0.58 | -1.3 |
| 1997 | 1.07 | -0.26 | -0.32 | 0.19 |
| 1998 | 3.67 | 0.7 | 1.15 | 2.79 |
| 1999 | 4.04 | 0.55 | 0.44 | 2.19 |
| 2000 | 4.25 | 3 | 0.92 | -0.65 |
| 2001 | -0.97 | 1.54 | 1.27 | 2.28 |
| 2002 | 3.43 | -0.15 | 1.79 | 0 |
| 2003 | 1.33 | 1.14 | 1.33 | 1.07 |
| 2004 | 0.84 | 3.08 | -1.02 | 1.45 |
| 2005 | 3.23 | 0.46 | 1.17 | 2.37 |
| 2006 | 3.26 | 2.47 | 2.12 | -0.23 |
| 2007 | 1.21 | 2.59 | 1.67 | 2.16 |
| 2008 | 0.5 | -0.38 | 0.59 | 0.82 |
| 2009 | 1 | 0.89 | -0.38 | 0.69 |
| 2010 | -1.53 | 1.31 | 1.68 | 1.43 |
| 2011 | -0.49 | 0.47 | 2.25 | 1.43 |
| 2012 | 4.11 | 5.26 | 2.3 | 1.19 |
| 2013 | 2.08 | -0.44 | 1.13 | 0.45 |
| 2014 | -0.98 | 0.24 | 0.31 | 0.58 |
| 2015 | 2.06 | 2.24 | 1.35 | 3.24 |
| 2016 | 4.55 | 2.75 | 2.1 | 4.05 |
| 2017 | 3.67 | 2.59 | 1.29 | 2.11 |
| 2018 | 1.76 | 1.51 | 2.1 | 0.2 |
| 2019 | 1.07 | -0.05 | 0.96 | 0.31 |
| 2020 | 3.82 | 1.7 | 2.15 | 1.95 |
| 2021 | 1.39 | 1.66 | 2.6 | 3.08 |
Figure 1. Average Seasonal Temperatures in the Contiguous 48 States, 1896–2021
Data source: NOAA, 2022
Web update: July 2022
Units: temperature anomaly (degrees F)
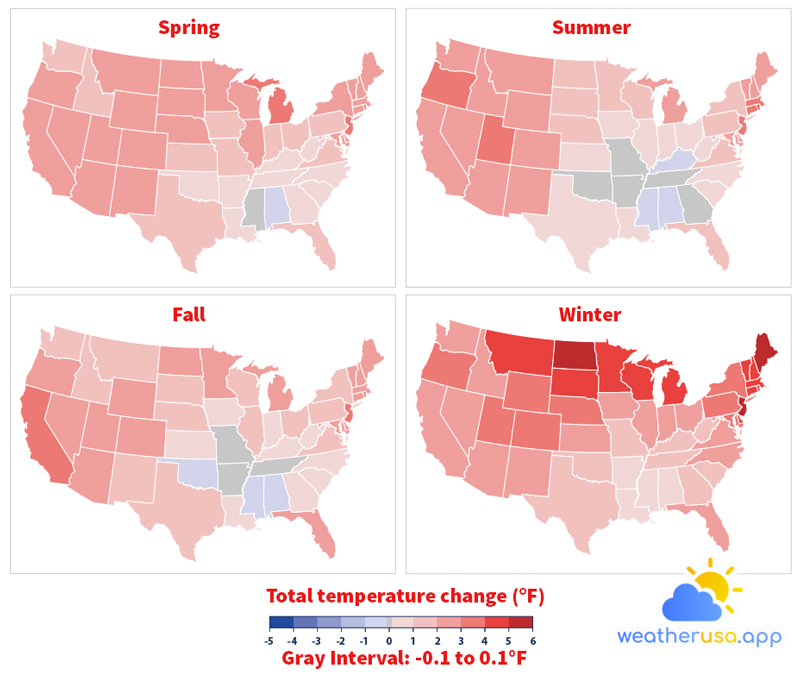
These maps show the total change in mean seasonal temperature in degrees Fahrenheit for each of the 48 contiguous states from 1896 to 2021. The real difference in temperature was calculated from the long-term average rate of change. The quarterly seasons are winter, spring, summer, and autumn.
| State | Winter | Spring | Summer | Fall |
| AK | ||||
| AL | 0.761942 | -0.11449 | -0.59516 | -0.24886 |
| AR | 0.802025 | 0.488408 | 0.061598 | -0.0937 |
| AZ | 2.57619 | 2.711828 | 2.477676 | 2.362805 |
| CA | 2.712261 | 2.728725 | 2.91737 | 3.023922 |
| CO | 3.243157 | 2.720935 | 2.583778 | 2.087064 |
| CT | 4.835846 | 2.830122 | 3.038565 | 2.785639 |
| DE | 4.034458 | 2.825189 | 2.966098 | 2.700037 |
| FL | 2.327747 | 1.731279 | 1.730832 | 2.088339 |
| GA | 1.97874 | 0.365488 | -0.02815 | 0.568129 |
| IA | 2.327409 | 1.586505 | 0.257219 | 0.687327 |
| ID | 2.570079 | 1.877799 | 2.078004 | 1.367192 |
| IL | 2.172291 | 2.145305 | 0.488774 | 1.040232 |
| IN | 2.206899 | 1.95237 | 0.176214 | 0.952306 |
| KS | 2.677165 | 1.930698 | 0.849337 | 0.728271 |
| KY | 1.454818 | 0.943609 | -0.26888 | 0.104949 |
| LA | 0.548181 | 0.348507 | 0.379825 | 0.441732 |
| MA | 4.532508 | 2.559758 | 3.097806 | 2.822085 |
| MD | 3.454931 | 2.257872 | 2.35541 | 2.134833 |
| ME | 5.332996 | 2.489852 | 2.774863 | 2.805887 |
| MI | 4.413761 | 3.175171 | 2.140242 | 2.129021 |
| MN | 4.922347 | 2.85849 | 1.83529 | 2.14117 |
| MO | 1.95808 | 1.41087 | 0.034306 | 0.083952 |
| MS | 0.566554 | 0.082961 | -0.35559 | -0.15013 |
| MT | 4.102925 | 2.701947 | 2.023136 | 1.701875 |
| NC | 2.061042 | 0.900436 | 0.768489 | 0.862992 |
| ND | 5.822722 | 2.589248 | 1.949769 | 2.020772 |
| NE | 3.171691 | 2.077082 | 1.027337 | 1.099775 |
| NH | 4.759993 | 2.52539 | 2.555982 | 2.570829 |
| NJ | 5.051856 | 3.203867 | 3.363969 | 3.200412 |
| NM | 2.469516 | 2.234367 | 2.111876 | 1.909524 |
| NV | 2.781327 | 2.286126 | 2.719212 | 2.212448 |
| NY | 3.848631 | 2.040034 | 1.46931 | 1.89715 |
| OH | 2.413348 | 1.917122 | 0.68139 | 1.27844 |
| OK | 1.555081 | 0.856923 | 0.08685 | -0.11699 |
| OR | 3.339108 | 2.281297 | 3.06215 | 2.377953 |
| PA | 3.180352 | 1.585786 | 1.173656 | 1.505774 |
| RI | 4.964529 | 3.255736 | 4.05824 | 3.213086 |
| SC | 1.975778 | 0.773795 | 0.559041 | 0.744619 |
| SD | 4.24072 | 2.04591 | 1.608975 | 1.451969 |
| TN | 1.165542 | 0.452233 | -0.00466 | 0.089014 |
| TX | 1.964192 | 1.65438 | 0.62194 | 1.071354 |
| UT | 3.32351 | 2.643924 | 3.25536 | 2.590701 |
| VA | 2.433371 | 1.310082 | 1.042605 | 1.104649 |
| VT | 4.783952 | 2.517756 | 2.078801 | 2.467567 |
| WA | 2.901387 | 1.333409 | 2.238524 | 1.387139 |
| WI | 4.128571 | 2.185894 | 1.076651 | 1.441095 |
| WV | 1.728871 | 0.97503 | 0.356602 | 0.790776 |
| WY | 3.611249 | 2.883275 | 2.370373 | 2.047282 |
Figure 2. Change in Seasonal Temperatures by State, 1896–2021
Data source: NOAA, 2022
Web update: July 2022
Units: total change (degrees F)
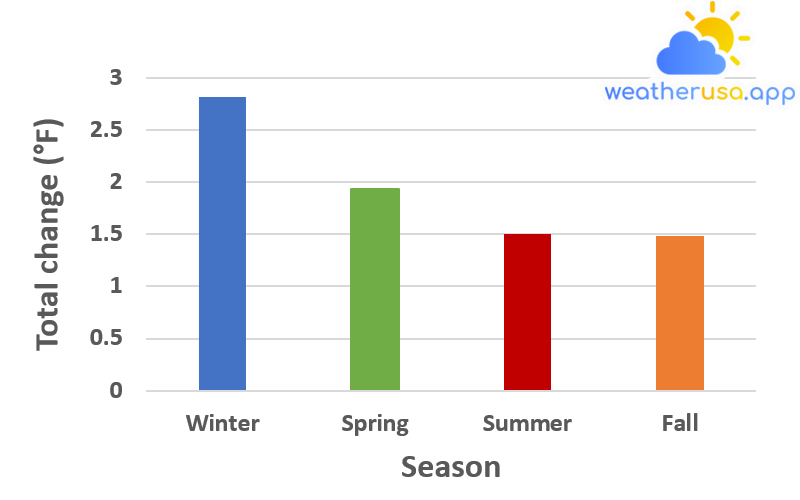
This figure shows the seasonal average annual temperature changes in degrees Fahrenheit for the 48 contiguous states from 1896 to 2021. The seasons are defined as winter, spring, summer, and autumn.
| Season | Total change |
| Winter | 2.816558 |
| Spring | 1.937687 |
| Summer | 1.50111 |
| Fall | 1.487934 |
Figure 3. Temperature Change by Season in the Contiguous 48 States, 1896–2021
Data source: NOAA, 2022
Web update: July 2022
Units: total change (degrees F)
Key Points
- Since 1896, average winter temperatures in the 48 contiguous states have increased by about 3°F (see Figures 1 and 3). Spring temperatures rose by about 2°F, while summer and autumn temperatures rose by about 1.5°F.
- A trend towards warmer winters is consistent with observed reductions in snow and shorter ice seasons. Warmer winter, spring, and autumn temperatures are consistent with longer growing seasons.
The higher average summer temperatures align with the observation that sweltering temperatures have become more frequent since the mid-20th century. - Temperature changes vary by state, with more significant seasonal increases in the northern states and the Mountain West and smaller increases in the South and Southeast (see Figure 2).
All 48 states have experienced winter warming during this time. Most states experienced warming in the spring, summer, and fall, but a few states had little or no overall change or slightly cooled (for example, Alabama) during these months.
Background
- As the world warms, average temperatures increase throughout the year, although the increases may be more significant in certain seasons than in others.
- Winter is particularly vulnerable to rising temperatures. Overall, minimum temperatures increased at a higher rate than average maximum temperatures. Therefore, most of the warming observed in the United States occurred when and where it was usually coldest, namely during the winter, at night, and in the northern parts of the country.
While the United States has had many winters with shallow temperatures, freezing winter temperatures have become less common—especially very cold nights.
Changing winter temperatures directly affect the amount of snow that falls and accumulates, the amount of seasonal snowpack, the timing of snowmelt, soil moisture loss through evapotranspiration, and the freezing time of lakes. - The warming experienced in other seasons can also affect daily life. For example, warmer spring and autumn temperatures extend the growing season, which can benefit some agriculture but also lead to a more prolonged and intense pollen season for allergy sufferers.
These changes may also raise the wildfire season. A warmer summer will likely mean more money spent on air conditioning, while a warmer winter may mean less money spent on home heating.
Seasonal warming can also disrupt the timing of events necessary to plants and animals, such as budding, flowering, hibernation, spawning, hatching, and migration.
About the Indicator
- This indicator examines changes in average temperatures during each season, defined here by calendar month (for example, winter is December, January, and February). The indicator is based on daily temperature measurements from more than 10,000 weather stations in the 48 contiguous states.
- Beginning in 1896, this indicator shows annual anomalies or differences compared to long-term average seasonal temperatures from 1901 to 2000 (Figure 1). For example, a peculiarity of +2.0°F in one winter means that the average winter temperature is 2 degrees higher than the long-term average.
Anomalies were calculated for each meteorological station. Daily temperature measurements in each region were used to calculate monthly anomalies and then averaged for each season to find temperature anomalies for each year. Average anomalies are calculated for areas within each state based on the area’s topography, station density, and proximity.
About the Data
Indicator Notes
Data from the early parts of the period are slightly less accurate than more recent data because fewer stations were collecting measurements at that time. However, the overall trends are still reliable.
Whenever possible, data are adjusted to account for deviations that may be brought about by factors such as station movements, urbanization near the station, changes in measuring instruments, and changes in precise times when measurements are made.
Alaska, Hawaii, and US territories are not included due to limitations in available data.
Data Sources
The data for this indicator were provided by the National Oceanic and Atmospheric Administration’s National Centers for Environmental Information, which maintains an extensive collection of climate data.

Weather 01852 - Lowell MA

49°
moderate rain
Feels like 47°05:33/19:49
51°F
/47°F
81%
1021 hPa
6 mi
5.75 mph


