Sea level
Climate change indicators: Sea level
This indicator describes changes in sea level over time. The hand describes two types of sea level change: absolute and relative.
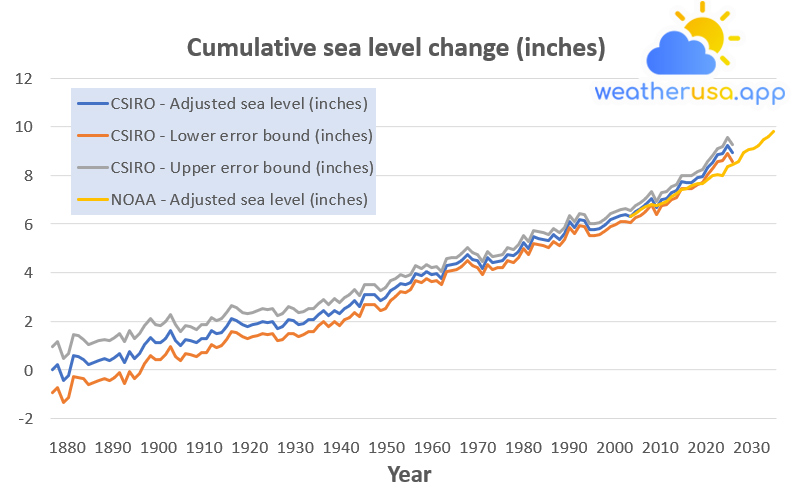
Figure 1. Global Average Absolute Sea Level Change, 1880–2021

This graph shows cumulative sea level changes for the world’s oceans since 1880, based on long-term tide gauge measurements and recent satellite measurements. This figure shows the mean absolute change in sea level, which refers to the height of the ocean surface, whether nearby land is rising or falling.
Satellite data is based only on measured sea level, while long-term tide gauge data includes a small correction factor as the size and shape of the oceans change slowly over time. The shaded band shows the likely range of values, depending on the number of measurements collected and the methods’ precision.
| Year | CSIRO – Adjusted sea level (inches) | CSIRO – Lower error bound (inches) | CSIRO – Upper error bound (inches) | NOAA – Adjusted sea level (inches) |
| 1880 | 0 | -0.95276 | 0.952756 | |
| 1881 | 0.220472 | -0.73228 | 1.173228 | |
| 1882 | -0.44094 | -1.34646 | 0.464567 | |
| 1883 | -0.23228 | -1.12992 | 0.665354 | |
| 1884 | 0.590551 | -0.28346 | 1.464567 | |
| 1885 | 0.531496 | -0.33071 | 1.393701 | |
| 1886 | 0.437008 | -0.38189 | 1.255906 | |
| 1887 | 0.216535 | -0.60236 | 1.035433 | |
| 1888 | 0.299213 | -0.51969 | 1.11811 | |
| 1889 | 0.362205 | -0.45669 | 1.181102 | |
| 1890 | 0.440945 | -0.37402 | 1.255906 | |
| 1891 | 0.374016 | -0.44094 | 1.188976 | |
| 1892 | 0.5 | -0.31496 | 1.314961 | |
| 1893 | 0.685039 | -0.11417 | 1.484252 | |
| 1894 | 0.30315 | -0.54724 | 1.153543 | |
| 1895 | 0.767717 | -0.08268 | 1.61811 | |
| 1896 | 0.468504 | -0.36614 | 1.30315 | |
| 1897 | 0.673228 | -0.14567 | 1.492126 | |
| 1898 | 1.043307 | 0.267717 | 1.818898 | |
| 1899 | 1.338583 | 0.574803 | 2.102362 | |
| 1900 | 1.125984 | 0.405512 | 1.846457 | |
| 1901 | 1.110236 | 0.417323 | 1.80315 | |
| 1902 | 1.291339 | 0.610236 | 1.972441 | |
| 1903 | 1.606299 | 0.937008 | 2.275591 | |
| 1904 | 1.200787 | 0.535433 | 1.866142 | |
| 1905 | 0.984252 | 0.377953 | 1.590551 | |
| 1906 | 1.251969 | 0.673228 | 1.830709 | |
| 1907 | 1.19685 | 0.610236 | 1.783465 | |
| 1908 | 1.098425 | 0.527559 | 1.669291 | |
| 1909 | 1.275591 | 0.700787 | 1.850394 | |
| 1910 | 1.271654 | 0.69685 | 1.846457 | |
| 1911 | 1.598425 | 1.03937 | 2.15748 | |
| 1912 | 1.476378 | 0.917323 | 2.035433 | |
| 1913 | 1.547244 | 0.992126 | 2.102362 | |
| 1914 | 1.795276 | 1.251969 | 2.338583 | |
| 1915 | 2.106299 | 1.570866 | 2.641732 | |
| 1916 | 2.031496 | 1.519685 | 2.543307 | |
| 1917 | 1.854331 | 1.350394 | 2.358268 | |
| 1918 | 1.791339 | 1.291339 | 2.291339 | |
| 1919 | 1.854331 | 1.354331 | 2.354331 | |
| 1920 | 1.905512 | 1.393701 | 2.417323 | |
| 1921 | 1.988189 | 1.472441 | 2.503937 | |
| 1922 | 1.952756 | 1.433071 | 2.472441 | |
| 1923 | 2 | 1.488189 | 2.511811 | |
| 1924 | 1.712598 | 1.19685 | 2.228346 | |
| 1925 | 1.791339 | 1.255906 | 2.326772 | |
| 1926 | 2.047244 | 1.507874 | 2.586614 | |
| 1927 | 2.003937 | 1.496063 | 2.511811 | |
| 1928 | 1.850394 | 1.366142 | 2.334646 | |
| 1929 | 1.905512 | 1.429134 | 2.38189 | |
| 1930 | 2.062992 | 1.590551 | 2.535433 | |
| 1931 | 2.047244 | 1.566929 | 2.527559 | |
| 1932 | 2.271654 | 1.80315 | 2.740157 | |
| 1933 | 2.440945 | 1.976378 | 2.905512 | |
| 1934 | 2.228346 | 1.759843 | 2.69685 | |
| 1935 | 2.448819 | 1.980315 | 2.917323 | |
| 1936 | 2.295276 | 1.830709 | 2.759843 | |
| 1937 | 2.519685 | 2.055118 | 2.984252 | |
| 1938 | 2.622047 | 2.15748 | 3.086614 | |
| 1939 | 2.826772 | 2.346457 | 3.307087 | |
| 1940 | 2.61811 | 2.181102 | 3.055118 | |
| 1941 | 3.098425 | 2.673228 | 3.523622 | |
| 1942 | 3.098425 | 2.673228 | 3.523622 | |
| 1943 | 3.098425 | 2.673228 | 3.523622 | |
| 1944 | 2.846457 | 2.425197 | 3.267717 | |
| 1945 | 2.956693 | 2.535433 | 3.377953 | |
| 1946 | 3.251969 | 2.834646 | 3.669291 | |
| 1947 | 3.374016 | 2.996063 | 3.751969 | |
| 1948 | 3.562992 | 3.19685 | 3.929134 | |
| 1949 | 3.511811 | 3.181102 | 3.84252 | |
| 1950 | 3.598425 | 3.287402 | 3.909449 | |
| 1951 | 3.972441 | 3.665354 | 4.279528 | |
| 1952 | 3.870079 | 3.566929 | 4.173228 | |
| 1953 | 4.043307 | 3.748031 | 4.338583 | |
| 1954 | 3.929134 | 3.641732 | 4.216535 | |
| 1955 | 3.964567 | 3.685039 | 4.244094 | |
| 1956 | 3.76378 | 3.488189 | 4.03937 | |
| 1957 | 4.291339 | 4.019685 | 4.562992 | |
| 1958 | 4.346457 | 4.086614 | 4.606299 | |
| 1959 | 4.358268 | 4.102362 | 4.614173 | |
| 1960 | 4.503937 | 4.244094 | 4.76378 | |
| 1961 | 4.748031 | 4.488189 | 5.007874 | |
| 1962 | 4.543307 | 4.283465 | 4.80315 | |
| 1963 | 4.480315 | 4.220472 | 4.740157 | |
| 1964 | 4.169291 | 3.905512 | 4.433071 | |
| 1965 | 4.610236 | 4.346457 | 4.874016 | |
| 1966 | 4.397638 | 4.137795 | 4.65748 | |
| 1967 | 4.452756 | 4.19685 | 4.708661 | |
| 1968 | 4.484252 | 4.220472 | 4.748031 | |
| 1969 | 4.751968 | 4.476378 | 5.027559 | |
| 1970 | 4.677165 | 4.401575 | 4.952756 | |
| 1971 | 4.88189 | 4.610236 | 5.153543 | |
| 1972 | 5.240157 | 4.968504 | 5.511811 | |
| 1973 | 5.003937 | 4.73622 | 5.271654 | |
| 1974 | 5.472441 | 5.204724 | 5.740157 | |
| 1975 | 5.409449 | 5.145669 | 5.673228 | |
| 1976 | 5.370079 | 5.102362 | 5.637795 | |
| 1977 | 5.30315 | 5.043307 | 5.562992 | |
| 1978 | 5.555118 | 5.291339 | 5.818898 | |
| 1979 | 5.362205 | 5.098425 | 5.625984 | |
| 1980 | 5.598425 | 5.34252 | 5.854331 | |
| 1981 | 6.086614 | 5.830709 | 6.34252 | |
| 1982 | 5.858268 | 5.610236 | 6.106299 | |
| 1983 | 6.188976 | 5.933071 | 6.444882 | |
| 1984 | 6.153543 | 5.905512 | 6.401575 | |
| 1985 | 5.748031 | 5.5 | 5.996063 | |
| 1986 | 5.771654 | 5.523622 | 6.019685 | |
| 1987 | 5.795276 | 5.551181 | 6.03937 | |
| 1988 | 5.980315 | 5.732283 | 6.228346 | |
| 1989 | 6.15748 | 5.905512 | 6.409449 | |
| 1990 | 6.248031 | 5.992126 | 6.503937 | |
| 1991 | 6.346457 | 6.090551 | 6.602362 | |
| 1992 | 6.374016 | 6.114173 | 6.633858 | |
| 1993 | 6.30315 | 6.043307 | 6.562992 | 6.306781 |
| 1994 | 6.507874 | 6.248031 | 6.767717 | 6.438652 |
| 1995 | 6.622047 | 6.362205 | 6.88189 | 6.576745 |
| 1996 | 6.783465 | 6.523622 | 7.043307 | 6.72371 |
| 1997 | 7.059055 | 6.799213 | 7.318898 | 6.779515 |
| 1998 | 6.669291 | 6.401575 | 6.937008 | 6.770265 |
| 1999 | 7.003937 | 6.73622 | 7.271654 | 6.840497 |
| 2000 | 7.055118 | 6.787402 | 7.322835 | 6.919122 |
| 2001 | 7.271654 | 7.007874 | 7.535433 | 7.116326 |
| 2002 | 7.366142 | 7.098425 | 7.633858 | 7.258224 |
| 2003 | 7.728346 | 7.456693 | 8 | 7.410512 |
| 2004 | 7.712598 | 7.440945 | 7.984252 | 7.465565 |
| 2005 | 7.716535 | 7.448819 | 7.984252 | 7.566646 |
| 2006 | 7.885827 | 7.61811 | 8.153543 | 7.678405 |
| 2007 | 7.96063 | 7.681102 | 8.240157 | 7.674413 |
| 2008 | 8.30315 | 8.035433 | 8.570866 | 7.828384 |
| 2009 | 8.531496 | 8.259843 | 8.80315 | 7.973213 |
| 2010 | 8.834646 | 8.555118 | 9.114173 | 8.030874 |
| 2011 | 8.897638 | 8.602362 | 9.192913 | 7.966928 |
| 2012 | 9.244094 | 8.917323 | 9.570866 | 8.36211 |
| 2013 | 8.913386 | 8.562992 | 9.26378 | 8.453538 |
| 2014 | 8.579036 | |||
| 2015 | 8.924984 | |||
| 2016 | 9.048399 | |||
| 2017 | 9.110986 | |||
| 2018 | 9.234521 | |||
| 2019 | 9.480223 | |||
| 2020 | 9.592477 | |||
| 2021 | 9.79722 |
Figure 1. Global Average Absolute Sea Level Change, 1880-2021
Data source: CSIRO, 2017; NOAA, 2022
Web update: July 2022
Units: inches
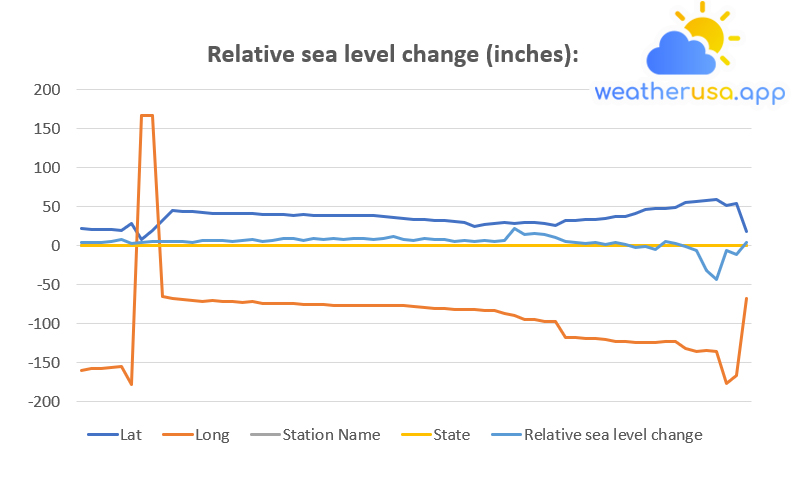
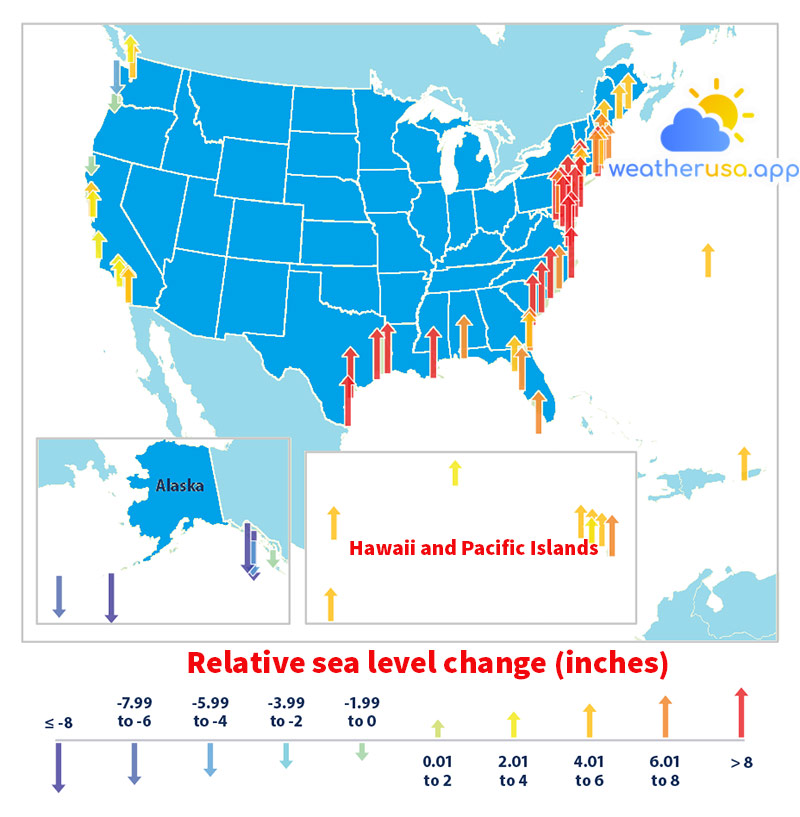
This map shows cumulative changes in relative sea level from 1960 to 2021 at tide stations along US coasts. Relative sea level reflects changes in sea level as well as land elevation.
| Lat | Long | Station Name | State | Relative sea-level change |
| 21.955 | -159.357 | Nawiliwili | Hawaii | 4.250787 |
| 21.307 | -157.867 | Honolulu | Hawaii | 3.722441 |
| 21.437 | -157.793 | Mokuoloe | Hawaii | 4.058661 |
| 20.898 | -156.472 | Kahului | Hawaii | 5.427559 |
| 19.73 | -155.057 | Hilo | Hawaii | 7.564961 |
| 28.212 | -177.36 | Midway Atoll | Pacific Ocean | 3.554331 |
| 8.737 | 167.738 | Kwajalein | Marshall Islands | 4.875197 |
| 19.29 | 166.618 | Wake Island | Pacific Ocean | 5.187402 |
| 32.373 | -64.703 | Bermuda | Atlantic Ocean | 5.211417 |
| 44.903 | -66.985 | Eastport | Maine | 5.30748 |
| 44.392 | -68.205 | Bar Harbor | Maine | 5.523622 |
| 43.657 | -70.247 | Portland | Maine | 4.562992 |
| 42.355 | -71.052 | Boston | Massachusetts | 6.940551 |
| 41.523 | -70.672 | Woods Hole | Massachusetts | 7.156693 |
| 41.505 | -71.327 | Newport | Rhode Island | 6.844488 |
| 41.807 | -71.402 | Providence | Rhode Island | 5.835827 |
| 41.355 | -72.087 | New London | Connecticut | 6.628346 |
| 41.048 | -71.96 | Montauk | New York | 8.261417 |
| 40.81 | -73.765 | Kings Point | New York | 5.595669 |
| 40.7 | -74.015 | The Battery | New York | 6.940551 |
| 40.467 | -74.01 | Sandy Hook | New Jersey | 10.01457 |
| 39.355 | -74.418 | Atlantic City | New Jersey | 9.990551 |
| 39.933 | -75.142 | Philadelphia | Pennsylvania | 7.348819 |
| 39.558 | -75.573 | Reedy Point | Delaware | 9.029921 |
| 38.782 | -75.12 | Lewes | Delaware | 8.669685 |
| 38.573 | -76.068 | Cambridge | Maryland | 9.342126 |
| 39.267 | -76.578 | Baltimore | Maryland | 7.781102 |
| 38.983 | -76.48 | Annapolis | Maryland | 8.957874 |
| 38.317 | -76.452 | Solomons Island | Maryland | 9.510236 |
| 38.873 | -77.022 | Washington | D. C. | 8.261417 |
| 37.167 | -75.988 | Kiptopeke | Virginia | 9.246063 |
| 36.947 | -76.33 | Sewells Point | Virginia | 11.38346 |
| 34.72 | -76.67 | Beaufort | North Carolina | 8.069291 |
| 34.227 | -77.953 | Wilmington | North Carolina | 6.26811 |
| 33.655 | -78.918 | Springmaid Pier | South Carolina | 9.678346 |
| 32.782 | -79.925 | Charleston | South Carolina | 8.141339 |
| 32.033 | -80.902 | Fort Pulaski | Georgia | 8.261417 |
| 30.672 | -81.465 | Fernandina Beach | Florida | 5.283465 |
| 30.397 | -81.43 | Mayport | Florida | 6.676378 |
| 24.553 | -81.808 | Key West | Florida | 6.051968 |
| 27.76 | -82.627 | St. Petersburg | Florida | 7.132677 |
| 29.135 | -83.032 | Cedar Key | Florida | 5.451575 |
| 30.403 | -87.212 | Pensacola | Florida | 6.220079 |
| 29.263 | -89.957 | Grand Isle | Louisiana | 22.04646 |
| 29.73 | -93.87 | Sabine Pass | Texas | 14.7937 |
| 29.31 | -94.793 | Galveston Pier 21 | Texas | 15.89843 |
| 28.022 | -97.047 | Rockport | Texas | 14.26535 |
| 26.06 | -97.215 | Port Isabel | Texas | 10.20669 |
| 32.713 | -117.173 | San Diego | California | 5.283465 |
| 32.867 | -117.258 | La Jolla | California | 4.899213 |
| 33.72 | -118.272 | Los Angeles | California | 2.497638 |
| 34.008 | -118.5 | Santa Monica | California | 3.674409 |
| 35.177 | -120.76 | Port San Luis | California | 2.329528 |
| 37.807 | -122.465 | San Francisco | California | 4.731102 |
| 37.772 | -122.298 | Alameda | California | 2.08937 |
| 41.745 | -124.183 | Crescent City | California | -1.92126 |
| 46.208 | -123.767 | Astoria | Oregon | -0.38425 |
| 48.368 | -124.617 | Neah Bay | Washington | -4.17874 |
| 47.605 | -122.338 | Seattle | Washington | 4.97126 |
| 48.547 | -123.01 | Friday Harbor | Washington | 2.857874 |
| 55.333 | -131.625 | Ketchikan | Alaska | -0.9126 |
| 57.052 | -135.342 | Sitka | Alaska | -5.93189 |
| 58.298 | -134.412 | Juneau | Alaska | -32.1331 |
| 59.45 | -135.327 | Skagway | Alaska | -43.2283 |
| 51.863 | -176.632 | Adak Island | Alaska | -6.05197 |
| 53.88 | -166.537 | Unalaska | Alaska | -10.9031 |
| 17.972 | -67.047 | Magueyes Island | Puerto Rico | 4.635039 |
Figure 2. Relative Sea Level Change Along U.S. Coasts, 1960-2021
Data source: NOAA, 2022
Web update: July 2022
Units: inches
Key points
- After about 2,000 years of little change, the global mean sea level rose throughout the 20th century, and the rate of change has accelerated in recent years.
Overall oceans Worldwide, the absolute sea level averaged 0.06 inches per year from 1880 to 2013 (see Figure 1).
Since 1993, however, the mean sea level has risen at a rate of 0.12 to 0.14 inches per year, about twice as fast as the long-term trend. - Relative sea level has risen along much of the U.S. coastline between 1960 and 2021, particularly the Mid-Atlantic Coast and parts of the Gulf Coast, where some stations have recorded increases of more than 8 inches (see Figure 2).
Meanwhile, relative sea levels have fallen in Alaska and the Pacific Northwest. Although the absolute sea level has risen at these sites, land elevation has increased more rapidly. - Although the absolute sea level has risen steadily, particularly in recent decades, regional trends vary.
The fundamental sea level has fallen in some places due to changes in coastal circulation patterns. - As the Earth’s temperature changes, the sea level also changes.
Background
- As the Earth’s temperature changes, so do the sea level.
- Changes in the amount of water and ice on land can increase or decrease the amount of water in the ocean.
- As the water warms, it expands slightly—an effect cumulative across the entire ocean depth.
- Changing sea levels can affect human activities in coastal areas. Rising sea levels inundate low-lying wetlands and dry land, erode coastlines, contribute to coastal flooding, and increase saltwater flow into estuaries and nearby aquifers.
Higher sea levels also make coastal infrastructure more vulnerable to storm damage.
- However, sea level changes affecting coastal systems are not only related to the expansion of the oceans because the Earth’s continents can also rise and fall relative to the oceans.
Soil can increase through processes such as sediment accumulation and geological uplift. In other areas, soils may subside due to erosion, sediment compaction, natural subsidence, groundwater withdrawal, or engineering projects that naturally prevent rivers from depositing sediment along their banks.
Changes in ocean currents, such as Gulf Stream, can also affect sea levels by pushing more water onto some coasts and pulling moisture away from others, raising or lowering sea levels respectively.
- Scientists explain these changes by measuring sea level change in two different ways. Relative sea level change refers to an increase or decrease in the height of the ocean close to land at a particular location.
In contrast, absolute sea level change refers to the elevation of the ocean’s surface above the center of the earth, regardless of whether nearby land rises or falls.
Evidence shows that sea levels along the US coast will increase by 10 to 12 inches by 2050—the same increase measured from 1920 to 2020.
About the indicator
- This indicator presents sea level trends based on measurements from tide gauges and satellites orbiting the Earth. Tide gauges measure the relative change in sea level at points along the coast.
In contrast, satellite instruments measure the absolute difference in sea level over almost the entire ocean surface. Many tide gauges have been collecting data for over 100 years, while satellites have been collecting data since the early 1990s.
- Figure 1 shows the absolute annual sea level change averaged over the entire surface of the Earth’s ocean. The long-term trend is based on tide gauge data that has been adjusted to show absolute global trends through calibration with recent satellite data.
This long-term dataset was calculated through 2013, while satellite data is now available through the end of 2021. Atlantic, Pacific, and Gulf Coasts of the United States.
About the Data
Indicator Notes
- Relative sea level trends represent absolute sea level change and local land motion. Tidal measurements such as those in Figure 2 generally cannot distinguish between these two influences without accurately measuring nearby vertical land motion.
- Some relative and absolute sea-level changes may be due to multi-year cycles such as El Niño and La Niña, which affect coastal ocean temperatures, salt content, wind patterns, atmospheric pressure, and currents.
Obtaining a reliable trend can require many years of data, so the satellite record in Figure 1 has been supplemented with a longer-term reconstruction based on tide gauge measurements.
Data Sources
Relative sea level data is available from the National Oceanic and Atmospheric Administration, which publishes an interactive map online with links to detailed data for each tide gauge.

Weather 01852 - Lowell MA

67°
clear sky
Feels like 66°05:31/19:51
70°F
/63°F
54%
1008 hPa
7 mi
6.91 mph


