
River Floods
Flood
A flood is an overflow of water that submerges land that is usually dry. In the sense of “flowing water,” the word can also refer to tides. Floods are an area of study in the discipline of hydrology and are a significant problem in agriculture, construction, and public health.
Human environmental changes often increase the intensity and frequency of flooding, for example, land use changes such as deforestation and wetland removal, changes in waterway flow or flood control measures such as levees, and more significant environmental issues such as climate change and sea level rise.
In particular, increased precipitation due to climate change and extreme weather events increase the severity of other flooding causes, leading to more intense flooding and an increased risk of flooding.

Climate Change Indicators: River Floods
Figure 1. Change in the Magnitude of River Flooding in the United States, 1965–2015
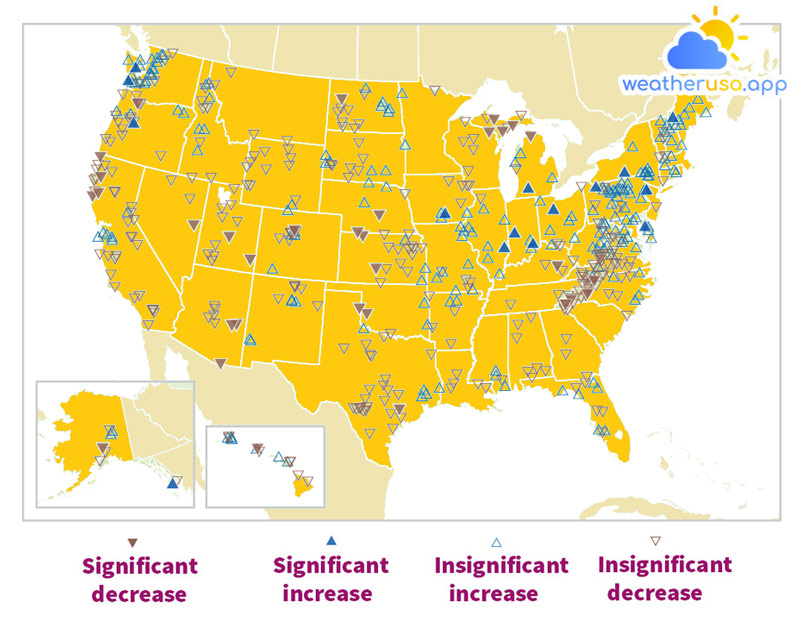
This figure shows changes in the magnitude of flood events in rivers and streams in the United States between 1965 and 2015.
Blue symbols pointing up indicate where the floods are growing; brown symbols meaning down indicate where the floods have shrunk. More significant, solid-colored symbols represent stations for which the change is statistically significant.
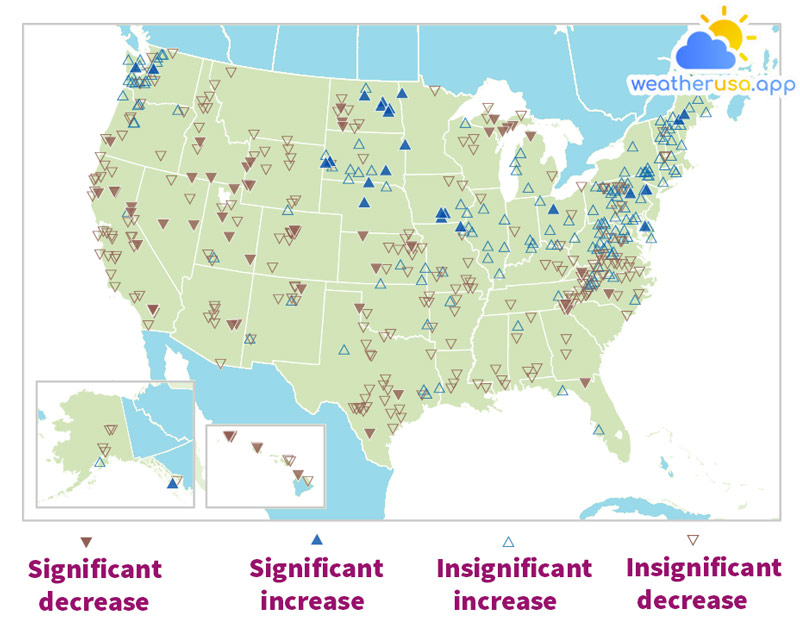
This figure shows the changes in the frequency of flood events in rivers and streams in the United States between 1965 and 2015.
Blue symbols pointing up indicate where floods are becoming more frequent; brown symbols meaning down indicate where flooding is less frequent. More significant, solid-colored symbols represent stations for which the change is statistically significant.
Key Points
- Floods were often more extraordinary in rivers and streams in the Northeast and Midwest. Flood size generally decreased in the West, southern Appalachia, and northern Michigan (see Figure 1).
- Major floods became more frequent in the Northeast, Pacific Northwest, and northern Great Plains. Flooding frequency has decreased in some parts of the country, particularly in the Southwest and Rockies (see Figure 2).
- Increases and decreases in the frequency and size of river floods often coincide with increases and decreases in the frequency of heavy rainfall events.
Background
- Rivers and streams are subject to flooding as a natural result of major rainstorms or the rapid flow of spring melt snow into streams and rivers.
Although the risk of flooding varies in the United States, most areas are vulnerable to flooding, even dry, mountainous regions.
The extent or magnitude of flood events depends on how much water enters upstream of the watercourse and how quickly it happens. The frequency of floods largely depends on the frequency of weather events.
- Major flooding events can damage homes, roads, bridges, and other infrastructure; destroy farmers’ crops; and harm or displace people.
While regular flooding helps maintain the nutrient balance of floodplain soils, larger or more frequent floods can disrupt ecosystems by replacing aquatic life, deteriorating water quality, and increasing soil erosion.
Floods can directly affect the water resources on which communities depend by filling water treatment systems with sediment and pollutants and encouraging the growth of harmful microbes. - Climate change may cause river floods to be more significant or more frequent in some places than before but smaller and less frequent in other sites.
Changes in the size and frequency of heavy rainfall events can affect river flooding, as higher temperatures cause more water to evaporate from land and oceans.
Changes in stream flow, the timing of snowmelt, and the amount of winter snowpack can also affect flood patterns.
About the Indicator
The US Geological Survey maintains thousands of flowmeters across the United States. Each gauge measures the water level and discharge, that is, the water flowing through the meter.
This indicator uses aggregate daily discharge data from approximately 500 long-term flow metering stations where trends are not significantly affected by dams, reservoir management, wastewater treatment plants, or land use change.
Based on daily discharge records, this indicator also analyzes whether significant flood events are becoming more frequent or less frequent over time.
About the Data
Indicator Notes
To counteract these effects, this indicator focuses on a range of sites that are largely unaffected by human activities in watersheds that do not have largely impervious surfaces such as concrete and asphalt.
If an area has protective infrastructure such as barriers or flood walls, increased flooding does not necessarily result in an increased risk to people or property.
Data Sources

Weather 01852 - Lowell MA

49°
overcast clouds
Feels like 47°05:32/19:50
51°F
/47°F
82%
1016 hPa
7 mi
4.61 mph


