Permafrost
Permafrost
- Permafrost is the ground on land or under the ocean that stays below 0 °C continuously for two or more years. Most common in the Northern Hemisphere, about 15% of the Northern Hemisphere, or 11% of the global surface, is covered by permafrost with a total area of about 18 million square kilometers.
This includes critical parts of Alaska, Greenland, Canada, and Siberia. It can also be found on mountaintops in the Southern Hemisphere and under ice-free areas in Antarctica. - Permafrost doesn’t have to be the first layer on the ground. It can be from an inch to several miles below the Earth’s surface.
It often occurs in ground ice but can also be found in non-porous bedrock. Permafrost consists of ice that holds various types of soil, sand, and rock. - Permafrost contains large amounts of decomposed biomass stored as methane and carbon dioxide, making the tundra soil a carbon sink.
As global warming warms the ecosystem and causes the earth to melt, the permafrost carbon cycle accelerates and releases most of these greenhouse gases in the soil into the atmosphere, creating a feedback loop that increases climate change.
Thawing permafrost is one of the effects of climate change. While the emissions from thawing permafrost are significant enough to cause additional warming, they probably won’t be enough to trigger self-reinforcing feedback that leads to “runaway warming.”
Climate Change Indicators: Permafrost
This index shows trends in permafrost temperatures at select locations in Alaska.
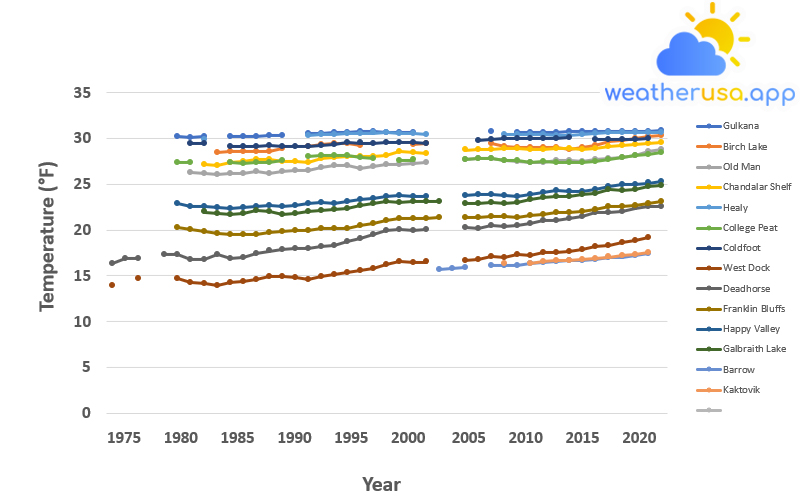
Figure 1. Permafrost Temperatures in Alaska, 1978–2020

This figure shows permafrost temperatures at borehole sites in inland Alaska, measured in late summer. Measurements at these sites were taken at depths between 49 and 85 feet.
Figure 1. Permafrost Temperatures in Alaska, 1978–2020
Data source: University of Alaska Fairbanks, 2019
Web update: April 2021
Units: °F
Data source: University of Alaska Fairbanks, 2019
Web update: April 2021
Units: °F
Figure 2. Change in Permafrost Temperatures in Alaska, 1978–2020
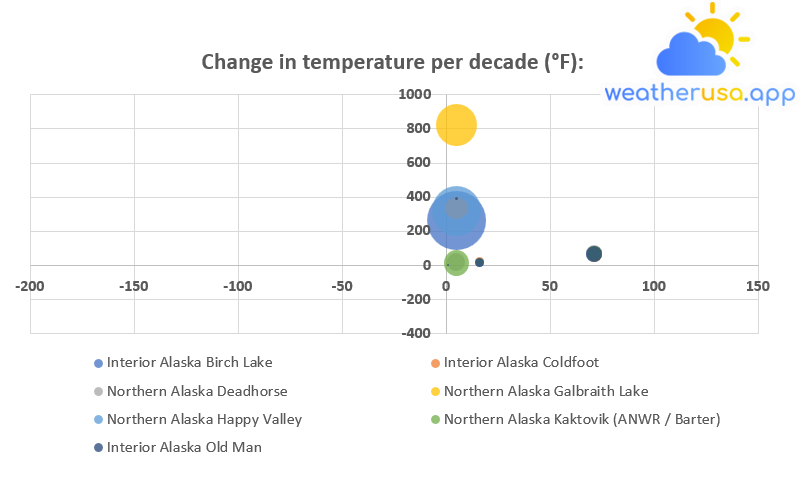
This map shows the per-decade change in permafrost temperature for long-term borehole locations in Alaska. As the circles get more prominent, the rate of warming per decade increases.
The blue circle represents the cooling trend. Borehole measuring depths range from 49 to 85 feet.
Figure 2. Changes in Permafrost Temperatures in Alaska, 1978–2020
Data source: University of Alaska Fairbanks, 2021
Web update: April 2021
Units: n/a; n/a; meters; degrees; degrees; meters; °F
Data source: University of Alaska Fairbanks, 2021
Web update: April 2021
Units: n/a; n/a; meters; degrees; degrees; meters; °F
Key Points
- From 1978 to 2020, permafrost temperatures increased in 14 of the 15 borehole locations shown in this indicator (see Figures 1 and 2). Statistically significant warming in 13 of the 14 boreholes increased.
- Permafrost generally warms faster in northern Alaska than in the hinterland (see Figure 2).
The increasing rate of change in the north is consistent with the change in air temperature, which is faster in northern Alaska than in other parts of the state. - Deadhorse site in northern Alaska has a higher rate of temperature change than in other parts of the state, at +1.5°F per decade.
The Livengood site in inland Alaska is the only one to have gotten colder in the recorded time, though only slightly.
Overall, permafrost temperatures have increased at an average rate of 0.6°F per decade. - The changes in permafrost temperatures shown in this indicator are consistent with those observed in Russia, Canada, and other parts of the Arctic.
Background
- Permafrost is defined as rock or soil with ice that has been frozen for two or more years. It usually lies beneath an “active layer” of land that freezes and thaws yearly.
Permafrost occurs in various forms with varying amounts of ice and is mainly found near the Arctic. In Alaska, about 80 percent of the land surface has underlying permafrost.
A critical feature that affects permafrost conditions is surface temperatures and shallow depths. The timing, amount, and extent of seasonal snow cover also affect permafrost.
A warming climate has brought higher temperatures to Alaska and other areas with permafrost, causing some layers of permafrost thaws.
Although the impact of climate change on permafrost varies at regional and local scales, permafrost thawing has been observed in many locations around the world. - Melting permafrost can lead to severe impacts on people and the environment. For example, when the permafrost is filled with ice melts, it can turn into a slurry that cannot support the weight of the soil and the vegetation above it.
Infrastructure such as roads, buildings, and pipelines can be damaged by permafrost thawing. Due to thawing permafrost, infrastructure damage and erosion have caused some communities’ fields in western and southern Alaska to be relocated.
Additionally, organic matter currently frozen in the permafrost will begin to decompose as the ground thaws, resulting in methane and carbon dioxide emissions into the atmosphere. This further contributes to global climate change.
About the Indicator
For more than 40 years, a team of scientists from the University of Alaska Fairbanks has studied permafrost across Alaska. They measured annual temperatures in 15 boreholes at least 50 feet deep and analyzed the data for long-term trends.
This dataset provides valuable information on how rapidly climate change observed in Alaska is affecting the permafrost.
Since the permafrost temperature can also be affected by land use changes such as urban development, agriculture, and other human activities, this index focuses on a select number of boreholes with relatively distant and undisturbed filters to better assess climate-related changes.
Figure 1 shows temperature measurements for each inland and northern Alaska borehole location.
About the Data
Indicator’s note
- Some of the borehole locations used in this indicator are based on data collected at depths below 65 feet, which may be affected by short-term variations in surface temperature or seasonal.
In addition, some locations are not measured annually, creating a gap of two to four years. Still, all the places included in this index meet the minimum data adequacy required for calculating long-term change.
Logistical issues cause slight fluctuations in the exact time measurements are collected each year, which can also add some uncertainty to the results. - This set of sites is not necessarily representative of all permafrost types or all temperature trends across Alaska.
The temperature of permafrost can vary depending on local environmental factors such as soil type, vegetation characteristics, and snow cover depth.
Notably, the permafrost in northern Alaska is naturally colder and more continuous than the permafrost in the interior.
Data Sources
The data in this indicator are based on seasonal measurements collected by the researchers and provided by Dr. Vladimir Romanovsky of the University of Alaska Fairbanks Permafrost Laboratory.
This dataset has been used and published as part of peer-reviewed journal articles on observed changes in regional and global permafrost.
This dataset has been used and published as part of peer-reviewed journal articles on observed changes in regional and global permafrost.
Weather 01852 - Lowell MA

38°
clear sky
Feels like 38°07:02/17:57
43°F
/36°F
83%
1025 hPa
7 mi
0 mph