Ocean Heat
Climate Change Indicators: Ocean Heat
This indicator identifies trends in the amount of heat stored in the world’s oceans.

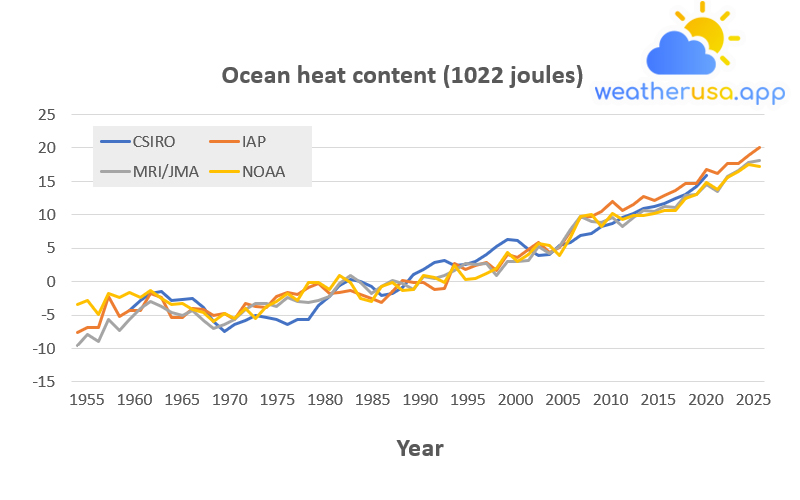
This figure shows changes in heat content in the top 700 meters of the world’s oceans between 1955 and 2020. Ocean heat content is measured in joules, a unit of energy, and compared to the 1971–2000 average set to zero as a reference.
Choosing a different reference period does not change the shape of the data over time. The lines were calculated independently using other methods by government agencies in four countries: the United States National Oceanic and Atmospheric Administration, Australia’s Commonwealth Scientific and Industrial Research Establishment, China’s Institute of Atmospheric Physics, and the Japan Meteorological Agency’s Meteorological Agency Research Institute.
For reference, an increase of 1 unit on this graph (1 × 10²² joules) equals approximately 17 times the total amount of energy used by all the people on Earth in a year.
| Year | CSIRO | IAP | MRI/JMA | NOAA |
| 1955 | -7.56743 | -9.49733 | -3.43723 | |
| 1956 | -6.93343 | -7.89733 | -2.84423 | |
| 1957 | -6.81043 | -8.94733 | -4.84923 | |
| 1958 | -2.27543 | -5.70733 | -1.76923 | |
| 1959 | -5.15443 | -7.34733 | -2.42523 | |
| 1960 | -4.27933 | -4.37543 | -5.68733 | -1.67823 |
| 1961 | -2.76933 | -4.25343 | -4.04733 | -2.35123 |
| 1962 | -1.76933 | -1.71643 | -2.92733 | -1.31123 |
| 1963 | -1.47933 | -2.35343 | -3.69733 | -2.50823 |
| 1964 | -2.80933 | -5.39043 | -4.60733 | -3.35723 |
| 1965 | -2.60933 | -5.30643 | -5.02733 | -3.29623 |
| 1966 | -2.47933 | -3.97943 | -4.32733 | -4.18023 |
| 1967 | -3.86933 | -4.18943 | -5.83733 | -4.59723 |
| 1968 | -5.94933 | -5.04543 | -7.07733 | -5.96423 |
| 1969 | -7.51933 | -4.75043 | -6.46733 | -4.71723 |
| 1970 | -6.34933 | -5.60043 | -5.63733 | -5.53423 |
| 1971 | -5.81933 | -3.31143 | -4.17733 | -4.00323 |
| 1972 | -5.12933 | -3.68643 | -3.33733 | -5.47523 |
| 1973 | -5.35933 | -3.82643 | -3.32733 | -3.75523 |
| 1974 | -5.60933 | -2.20943 | -3.71733 | -3.01123 |
| 1975 | -6.45933 | -1.70043 | -2.31733 | -1.78723 |
| 1976 | -5.63933 | -1.91343 | -3.04733 | -2.83923 |
| 1977 | -5.69933 | -0.90843 | -3.15733 | -0.20423 |
| 1978 | -3.62933 | -0.35443 | -2.81733 | -0.18423 |
| 1979 | -2.29933 | -1.72243 | -2.19733 | -1.19623 |
| 1980 | -0.55933 | -1.70243 | -0.31733 | 0.854767 |
| 1981 | 0.350667 | -1.34243 | 0.932667 | -0.11423 |
| 1982 | 0.020667 | -1.99343 | -0.11733 | -2.54223 |
| 1983 | -0.71933 | -2.50343 | -1.78733 | -2.99923 |
| 1984 | -2.00933 | -3.05343 | -0.79733 | -0.69523 |
| 1985 | -1.72933 | -1.44443 | 0.232667 | -0.12623 |
| 1986 | -0.90933 | 0.221567 | -0.34733 | -1.27323 |
| 1987 | 0.990667 | -0.07443 | -1.13733 | -1.12923 |
| 1988 | 1.850667 | -0.19743 | 0.722667 | 0.851767 |
| 1989 | 2.820667 | -1.15343 | 0.532667 | 0.666767 |
| 1990 | 3.200667 | -1.10043 | 0.882667 | -0.05923 |
| 1991 | 2.390667 | 2.728567 | 1.692667 | 2.409767 |
| 1992 | 2.580667 | 1.785567 | 2.752667 | 0.335767 |
| 1993 | 2.950667 | 2.345567 | 2.532667 | 0.447767 |
| 1994 | 3.990667 | 2.822567 | 2.722667 | 1.273767 |
| 1995 | 5.270667 | 1.608567 | 0.972667 | 2.027767 |
| 1996 | 6.330667 | 4.092567 | 2.972667 | 4.307767 |
| 1997 | 6.210667 | 3.549567 | 3.082667 | 3.008767 |
| 1998 | 4.780667 | 4.793567 | 3.212667 | 4.067767 |
| 1999 | 3.840667 | 5.896567 | 5.192667 | 5.706767 |
| 2000 | 3.990667 | 4.353567 | 4.162667 | 5.435767 |
| 2001 | 5.370667 | 5.172567 | 5.282667 | 3.880767 |
| 2002 | 5.830667 | 7.476567 | 7.732667 | 6.552767 |
| 2003 | 6.920667 | 9.650567 | 9.812667 | 9.715767 |
| 2004 | 7.230667 | 9.676567 | 9.022667 | 10.00377 |
| 2005 | 8.280667 | 10.41557 | 8.862667 | 8.175767 |
| 2006 | 8.750667 | 11.94857 | 9.622667 | 10.19377 |
| 2007 | 9.610667 | 10.66557 | 8.172667 | 9.241767 |
| 2008 | 10.24067 | 11.51157 | 9.592667 | 9.815767 |
| 2009 | 10.89067 | 12.72557 | 10.63267 | 9.889767 |
| 2010 | 11.29067 | 12.14257 | 10.51267 | 10.13077 |
| 2011 | 11.65067 | 12.94757 | 11.24267 | 10.63277 |
| 2012 | 12.39067 | 13.66957 | 11.02267 | 10.70477 |
| 2013 | 13.01067 | 14.69857 | 12.85267 | 12.36477 |
| 2014 | 14.22067 | 14.71557 | 13.08267 | 13.02477 |
| 2015 | 15.88067 | 16.78257 | 14.51267 | 14.88577 |
| 2016 | 16.21657 | 13.52267 | 13.73577 | |
| 2017 | 17.59557 | 15.74267 | 15.64177 | |
| 2018 | 17.63057 | 16.64267 | 16.48577 | |
| 2019 | 18.93357 | 17.87267 | 17.48977 | |
| 2020 | 20.00757 | 18.08267 | 17.28777 |
Figure 1. Heat Content in the Top 700 Meters of the World’s Oceans, 1955–2020
Data source: CSIRO, 2016; IAP, 2021; MRI/JMA, 2021; NOAA, 2021
Web update: April 2021
Units: 10^22 joules
Figure 2. Heat Content in the Top 2,000 Meters of the World’s Oceans, 1955–2020
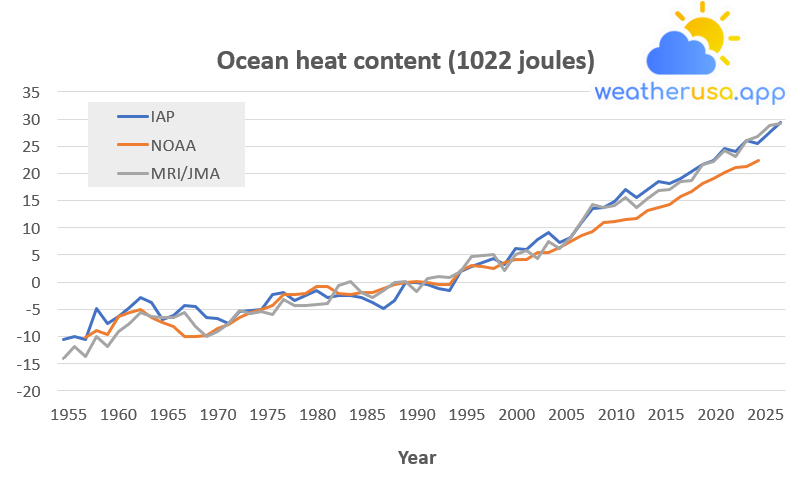
This figure shows changes in heat content in the top 2,000 meters of the world’s oceans between 1955 and 2020. Ocean heat content is measured in joules, an energy unit, compared to the 1971–2000 average. Zero for reference.
Choosing a different reference period does not change the shape of the data over time. The lines were calculated independently using other methods by government agencies in three countries: the National Oceanic and Atmospheric Administration of the United States, China’s Institute of Atmospheric Physics, and the Meteorological Research Institute of the Japan Meteorological Agency.
For reference, a 1-unit increase in this graph equates to approximately 17 times the total amount of energy that all people in the world use in one year.
| Year | IAP | NOAA | MRI/JMA |
| 1955 | -10.506 | -14.0327 | |
| 1956 | -10.054 | -11.8627 | |
| 1957 | -10.476 | -10.1693 | -13.6327 |
| 1958 | -4.87903 | -8.92527 | -9.96267 |
| 1959 | -7.60503 | -9.57927 | -11.7827 |
| 1960 | -6.25903 | -6.34527 | -9.02267 |
| 1961 | -4.63003 | -5.62827 | -7.52267 |
| 1962 | -2.81603 | -4.98727 | -5.65267 |
| 1963 | -3.73203 | -6.56327 | -6.26267 |
| 1964 | -6.87703 | -7.38727 | -6.59267 |
| 1965 | -6.22003 | -8.08427 | -6.52267 |
| 1966 | -4.25403 | -9.98827 | -5.54267 |
| 1967 | -4.43303 | -9.92527 | -8.22267 |
| 1968 | -6.41003 | -9.85727 | -10.0127 |
| 1969 | -6.61803 | -8.48627 | -9.06267 |
| 1970 | -7.66103 | -7.70427 | -7.60267 |
| 1971 | -5.33603 | -6.49327 | -5.20267 |
| 1972 | -5.14603 | -5.63627 | -5.83267 |
| 1973 | -4.96203 | -4.95327 | -5.36267 |
| 1974 | -2.18703 | -4.22027 | -5.86267 |
| 1975 | -1.98103 | -2.26427 | -3.16267 |
| 1976 | -3.44303 | -2.31127 | -4.22267 |
| 1977 | -2.49203 | -2.00927 | -4.29267 |
| 1978 | -1.50703 | -0.81027 | -4.18267 |
| 1979 | -2.84003 | -0.79827 | -3.86267 |
| 1980 | -2.39403 | -2.04227 | -0.54267 |
| 1981 | -2.38203 | -2.24927 | 0.197333 |
| 1982 | -2.75803 | -1.93927 | -1.98267 |
| 1983 | -3.65603 | -1.84027 | -2.83267 |
| 1984 | -4.85103 | -1.07627 | -1.55267 |
| 1985 | -3.31103 | -0.38527 | -0.09267 |
| 1986 | -0.11103 | -0.14827 | 0.127333 |
| 1987 | 0.025967 | 0.156733 | -1.74267 |
| 1988 | -0.41203 | -0.02227 | 0.717333 |
| 1989 | -1.20503 | -0.45427 | 0.967333 |
| 1990 | -1.46503 | -0.34927 | 0.947333 |
| 1991 | 1.983967 | 2.169733 | 2.037333 |
| 1992 | 2.842967 | 3.032733 | 4.677333 |
| 1993 | 3.526967 | 2.973733 | 4.917333 |
| 1994 | 4.291967 | 2.542733 | 5.037333 |
| 1995 | 3.310967 | 3.676733 | 2.117333 |
| 1996 | 6.237967 | 4.166733 | 5.097333 |
| 1997 | 6.033967 | 4.129733 | 5.827333 |
| 1998 | 7.815967 | 5.366733 | 4.357333 |
| 1999 | 9.056967 | 5.367733 | 7.567333 |
| 2000 | 7.311967 | 6.419733 | 6.137333 |
| 2001 | 8.307967 | 7.417733 | 8.187333 |
| 2002 | 11.04597 | 8.614733 | 11.18733 |
| 2003 | 13.55197 | 9.306733 | 14.34733 |
| 2004 | 13.69397 | 10.93973 | 13.70733 |
| 2005 | 14.80497 | 11.12973 | 14.10733 |
| 2006 | 17.05797 | 11.55673 | 15.49733 |
| 2007 | 15.58897 | 11.79773 | 13.67733 |
| 2008 | 16.98397 | 13.23573 | 15.45733 |
| 2009 | 18.53997 | 13.72073 | 16.87733 |
| 2010 | 18.15897 | 14.36273 | 17.03733 |
| 2011 | 19.13097 | 15.81473 | 18.45733 |
| 2012 | 20.41497 | 16.69673 | 18.71733 |
| 2013 | 21.73197 | 18.13773 | 21.57733 |
| 2014 | 22.45397 | 19.13473 | 22.25733 |
| 2015 | 24.63197 | 20.20773 | 24.18733 |
| 2016 | 24.05497 | 21.01273 | 23.12733 |
| 2017 | 26.11097 | 21.28073 | 26.14733 |
| 2018 | 25.42697 | 22.42773 | 26.82733 |
| 2019 | 27.44597 | 28.77733 | |
| 2020 | 29.42097 | 29.27733 |
Figure 2. Heat Content in the Top 2,000 Meters of the World’s Oceans, 1955–2020
Data source: IAP, 2021; MRI/JMA, 2021; NOAA, 2021
Web update: April 2021
Units: 10^22 joules
Key Points
- In four different data analyzes, the long-term trend shows that the upper 700 meters of the oceans have warmed since 1955 (see Figure 1).
All three analyzes in Figure 2 show additional warming when the top 2,000 meters of the oceans are included. These results show that the heat absorbed by the surface waters extends to much lower depths over time. - Although greenhouse gas concentrations have increased relatively steadily over the past few decades, the rate of change in ocean heat content can vary from year to year (see Figures 1 and 2).
Volcanic eruptions and recurring ocean-atmosphere patterns such as El Niño influence year-to-year changes.
Background
- When sunlight reaches the Earth’s surface, the oceans absorb some of this energy and store it as heat. This heat is initially absorbed in the surface, but some eventually diffuses into deeper waters.
- Currents also move this heat around the world. Water has a much higher heat capacity than air, meaning the oceans can absorb more significant amounts of heat energy with only a slight increase in temperature.
- The total amount of heat the oceans store is called “ocean heat content,” Water temperature measurements reflect the amount of heat in the water at a given time and location.
Ocean temperature plays an essential role in Earth’s climate system, particularly sea surface temperature because heat from ocean surface waters provides energy for storms and thus affects weather.
- Increasing greenhouse gas concentrations are trapping more energy from the sun. Because changes in ocean systems have occurred over the centuries, the oceans have not yet warmed as much as the atmosphere, even though they have absorbed more than 90 percent of the Earth’s extra heat since 1955, and the heat retention rate of the oceans has doubled since then 1993.
The atmosphere would warm faster without the excellent heat storage capacity provided by the oceans. Increased heat absorption also modifies ocean currents because many currents are driven by temperature differences that cause density differences.
These currents affect climate patterns and sustain ecosystems that depend on specific temperature ranges.
- As water expands slightly as it warms, an increase in ocean heat content will also increase the volume of water in the ocean, which is one of the most important reasons for the observed increases in sea level.
For all these reasons, ocean heat content is one of the most important indicators to track the causes and responses of a changing climate.
About the Indicator
- This indicator shows trends in global ocean heat content from 1955 to 2020. Measurement data are available for the upper 2,000 meters of the ocean, which accounts for about half of the total water volume in the world’s oceans.
This indicator also shows changes representing the top 700 meters of the world’s oceans, where most of the observed warming occurs. The gauge measures the ocean heat content in joules and energy units.
- Organizations worldwide have calculated changes in ocean heat content based on measurements of ocean temperatures at different depths. These measurements come from ships, aircraft, and various vehicles recently deployed by underwater robots.
Therefore, data must be carefully adjusted to account for differences between measurement techniques and data collection programs. Figure 1 shows four independent interpretations of the data for the top 700 meters of the ocean, which are the same. Figure 2 shows three independent variations for the total 2,000 meters of the sea.
About the Data
Indicator Notes
Scientists continue to compare their results and improve their predictions over time. They also test estimates of ocean temperature by looking at corresponding changes in other ocean features.
For example, they can check whether the observed changes in sea level match the expected amount of sea level rise based on the estimated change in ocean temperature.
Data Sources
The data were independently analyzed by researchers at NOAA, Australia’s Commonwealth Scientific and Industrial Research Establishment, China’s Institute of Atmospheric Physics, and the Meteorological Research Institute of the Japan Meteorological Agency.

Weather 01852 - Lowell MA

56°
clear sky
Feels like 55°05:31/19:51
61°F
/50°F
80%
1007 hPa
7 mi
1.01 mph


