Ocean Acidity
Ocean Acidity
- Ocean acidification is the process by which the pH of the Earth’s oceans decreases as they absorb more carbon dioxide from the atmosphere.
The oceans absorb about a quarter of the carbon dioxide released into the atmosphere each year, and as they do so, they become more acidic.
This process occurs as a result of human activities, such as burning fossil fuels, which release large amounts of carbon dioxide into the atmosphere. - The pH of the oceans has decreased by about 0.1 units since the beginning of the Industrial Revolution, which corresponds to a 30% increase in acidity. This may not seem like a significant change, but it can significantly impact marine ecosystems.
For example, some marine organisms, such as corals and shellfish, are sensitive to changes in pH and may struggle to grow and reproduce in more acidic conditions.
In addition, acidification can affect the behavior and survival of other marine species, such as fish and plankton, which can have cascading effects on the entire marine ecosystem. - There is growing concern about the potential impacts of ocean acidification on marine life and on the people who rely on the oceans for food and other resources—as such, reducing carbon dioxide emissions is seen as an essential way to address this issue and protect the health of the oceans.
Climate Change Indicators: Ocean Acidity
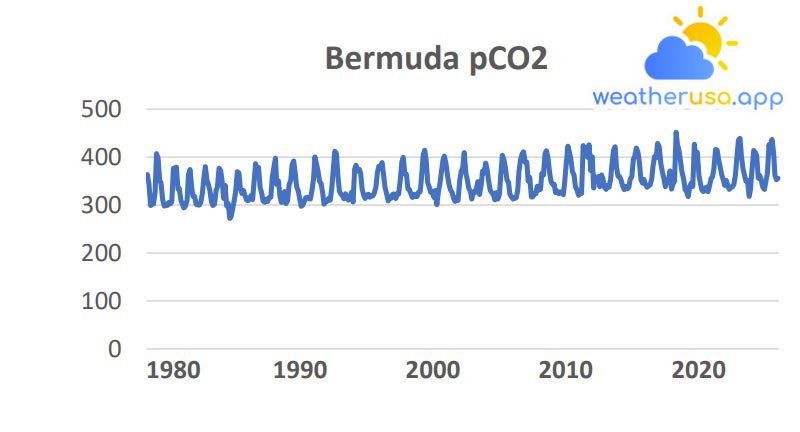
This index describes changes in ocean chemistry related to the amount of carbon dioxide dissolved in the water.
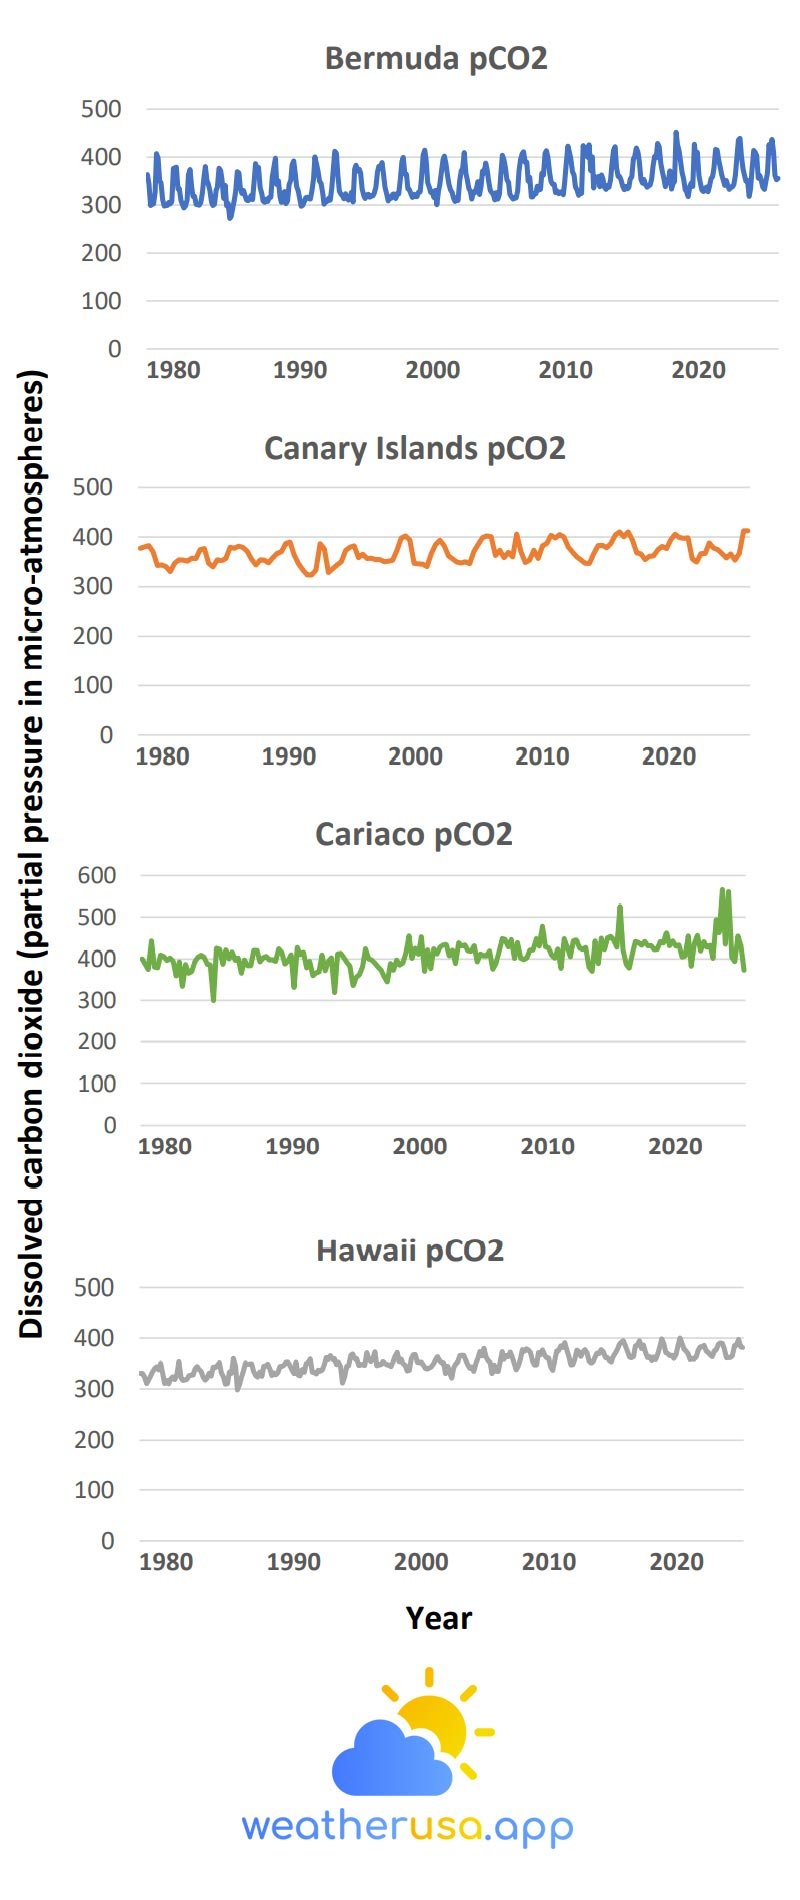
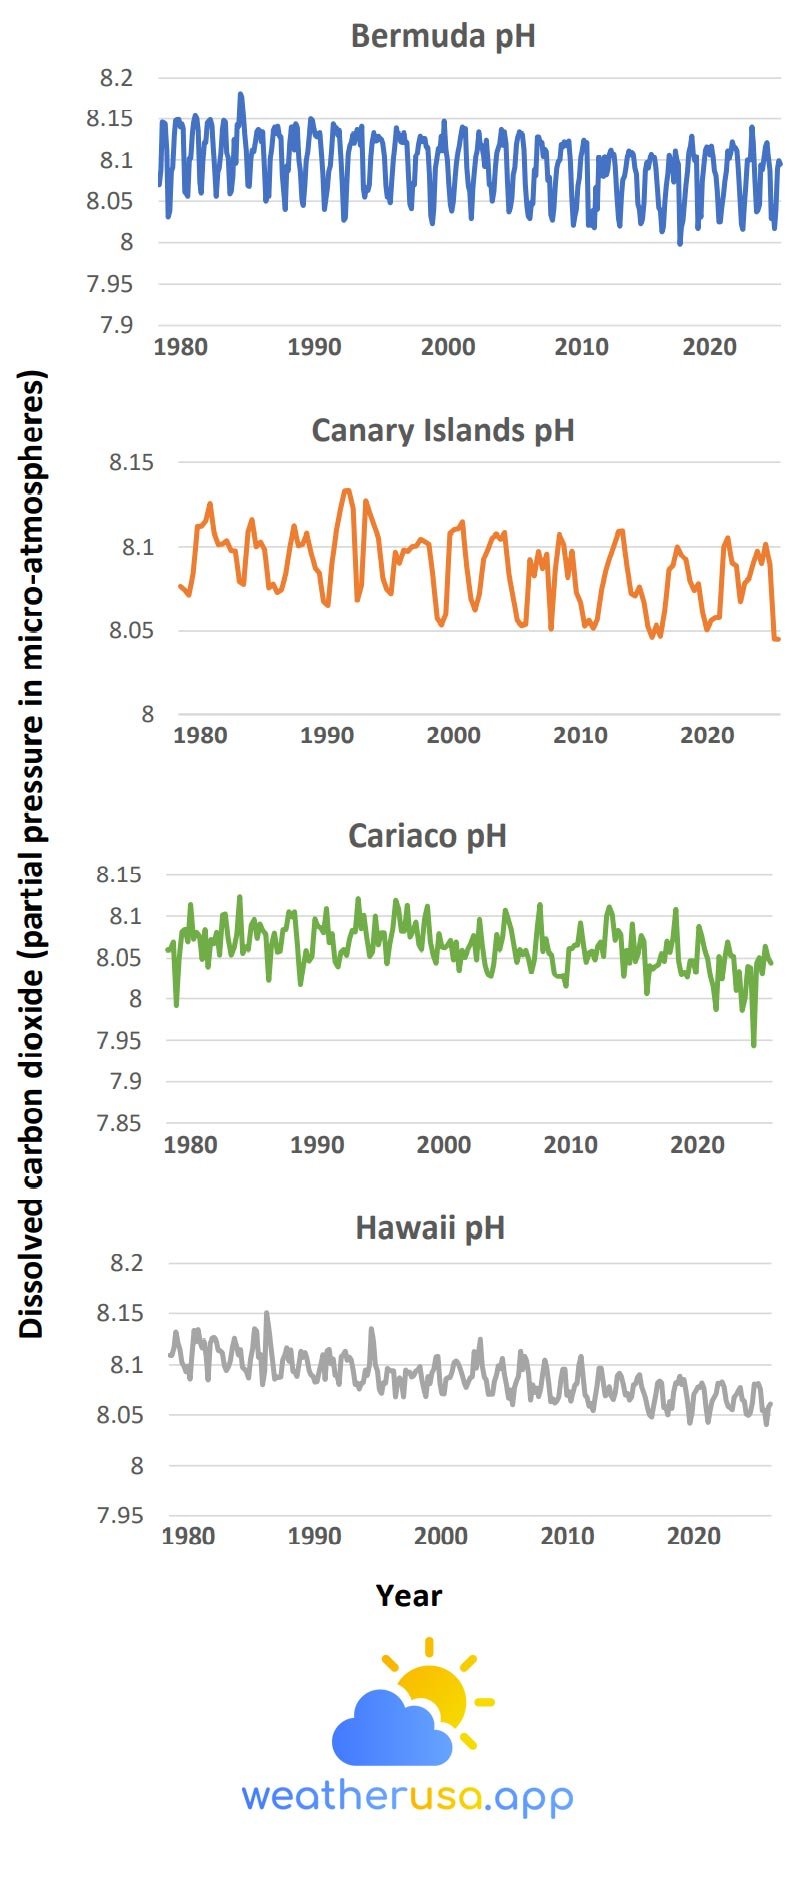
The data comes from two observation stations in the North Atlantic, one in the Caribbean and one in the Pacific. The up-and-down pattern shows the effect of seasonal variations.
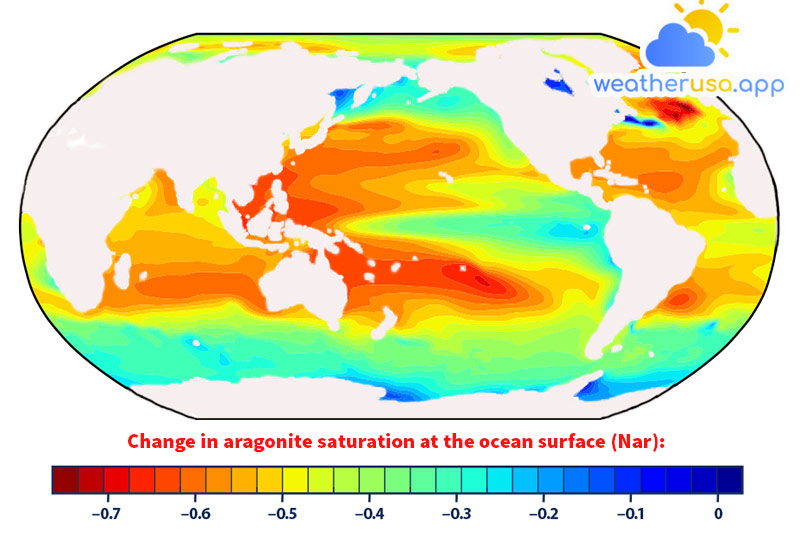
This map shows changes in the aragonite saturation levels of ocean surface waters between the 1880s and the most recent decade. Aragonite is a form of calcium carbonate that many marine animals use to build their skeletons and shells.
The lower the saturation level, the harder it is for organisms to develop and maintain their skeletons and shells. An unfavorable change represents a decrease in saturation.
pH Scale
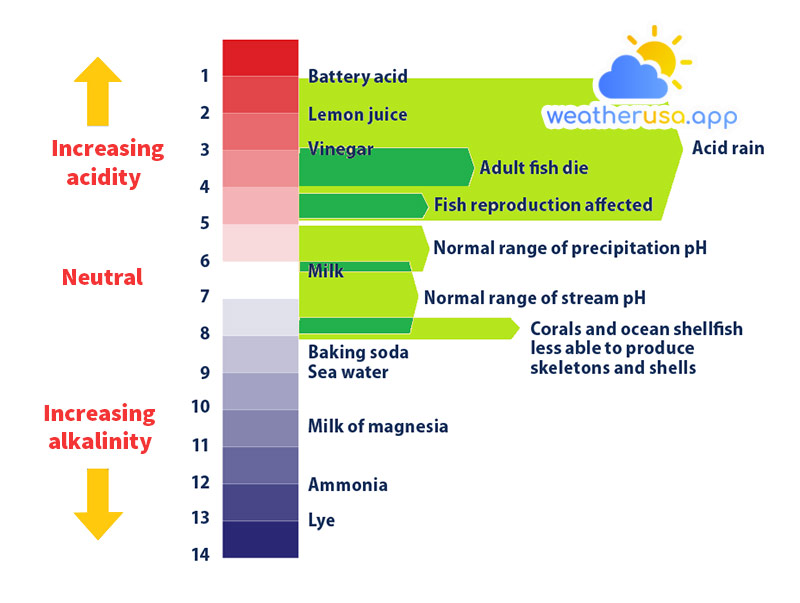
Acidity is usually measured using the pH scale. Pure water has a pH of around 7, which is considered neutral. A substance with a pH less than 7 is considered acidic, while a substance with a pH greater than 7 is considered basic or alkaline.
The lower the pH, the more acidic the substance. Like the famous Richter scale for measuring earthquakes, the pH scale is based on a power of 10, meaning that a substance with a pH of 3 is 10 times more acidic than a substance with a pH of 4.
Key points
- Measurements conducted over the past few decades have demonstrated that carbon dioxide levels in the ocean have increased in response to increased atmospheric carbon dioxide, leading to an increase in acidity (that is, a decrease in pH) (see Figure 1).
- Historical modeling suggests that since the 1880s, increased carbon dioxide has led to lower aragonite saturation levels in oceans around the world, making it difficult for some organisms to build and maintain skeletons and their shells (see Figure 2).
- The most significant decrease in aragonite saturation occurs in tropical seas (see Figure 2); however, deterioration in cold regions may be of more substantial concern as more frigid waters typically have lower aragonite saturation levels in the first place.
Background
- The ocean is essential in regulating the amount of carbon dioxide in the atmosphere. As the concentration of carbon dioxide in the atmosphere increases, the sea will absorb more carbon dioxide.
Because of the slow mixing time between surface and deeper water, establishing this balance can take hundreds to thousands of years.
Over the past 250 years, the oceans have absorbed about 28% of the carbon dioxide produced by human activities.
- While the ocean’s ability to absorb carbon dioxide prevents atmospheric concentrations from rising even further, increased levels of dissolved carbon dioxide in the sea can hurt some marine life.
Carbon dioxide reacts with seawater to produce carbonic acid. An increase in acidity changes the balance of minerals in the water. This makes it more difficult for corals, some plankton, and other organisms to create calcium carbonate, a critical ingredient in their skeletons or hard shells.
As a result, a reduced pH can make it harder for these animals to grow. This could lead to more significant changes in the overall structure of ocean and coastal ecosystems, ultimately affecting fish populations and the people who depend on them.
- Although changes in the ocean’s pH and mineral saturation due to atmospheric carbon dioxide uptake typically occur over decades, these properties can fluctuate over shorter periods, especially in coastal and surface waters.
For example, increased photosynthesis during the day and during the summer leads to natural fluctuations in pH. Acidity also changes with water temperature.
About the Indicator
- This indicator describes trends in the pH and related properties of seawater based on a combination of direct observations, calculations, and modeling.
- Figure 1 shows the pH values and dissolved carbon dioxide levels at four sites that have consistently collected measurements over the past few decades.
These data are measured directly or calculated from related measurements, such as dissolved inorganic carbon and alkalinity. The data comes from two stations in the Atlantic, one in the Caribbean and one in the Pacific.
- The global map in Figure 2 shows changes over time in aragonite saturation levels. Aragonite is a specific form of calcium carbonate that many organisms produce and use to build their skeletons and shells, and saturation measures how easily aragonite can dissolve in water.
The lower the saturation level, the harder it is for organisms to build and maintain their skeletons and protective shells. This map was created by comparing average conditions for the 1880s with average conditions for the most recent 10 years.
Aragonite saturation has only been measured at selected sites over the past few decades. Still, it can be reliably calculated for different times and locations based on the relationship that scientists have observed between aragonite saturation, pH, dissolved carbon, water temperature, atmospheric concentrations of carbon dioxide, and other elements can be measured.
Therefore, although Figure 2 is generated using a computer model, it is based on measurements.
About the Data
Indicator Notes
Studies suggest that the impact of ocean acidification may be more fantastic at depth because aragonite saturation levels are naturally lower in deeper waters.
For example, carbon dioxide dissolves more readily in cold water than in warm water, so colder regions can suffer a more significant impact from acidity than more hospitable regions. Air and water pollution also leads to increased edge in some areas.
Data Sources

Weather 01852 - Lowell MA

59°
clear sky
Feels like 58°05:31/19:51
64°F
/53°F
82%
1008 hPa
7 mi
4.61 mph


