MEASUREMENT OF WIND FACTORS
MEASUREMENT OF WIND FACTORS
The wind is characterized by two factors, direction, and speed
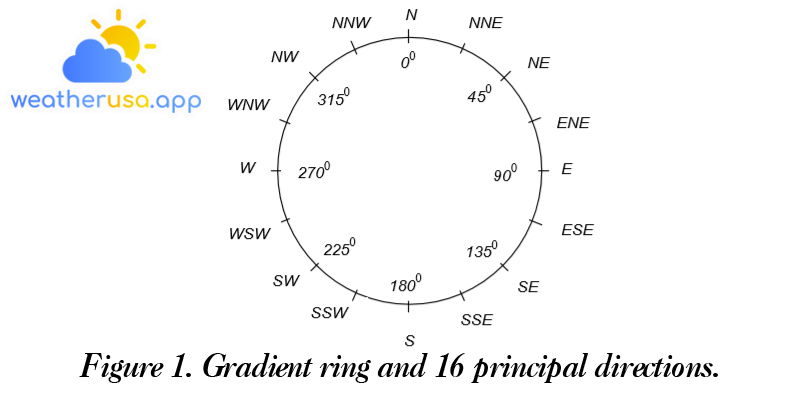
| Direction | N | NNE | NE | ENE | E | ESE | SE | SSE |
| Degrees | 349°-11 | 12-33 | 34-56 | 57-78 | 79-101 | 102-123 | 124-146 | 147-168 |
| Direction | S | SSW | SW | WSW | W | WNW | NW | NNW |
| Degrees | 169-191 | 192-213 | 214-236 | 237-258 | 259-281 | 282-303 | 304-326 | 327-348 |
The instrument for measuring wind factors
Its structure consists of four halves of the bridge deck mounted diagonally into a cross-shaped propeller connected to a mechanical counter.
The weight and dimensions of the cruciform propeller, together with the four spherical halves, must be chosen so that every three revolutions corresponds to one meter of the path of a gas element.
With one hand holding the windmill, raised to head level in the direction of the incoming wind, open the counter lever. At the same time, the other hand turns on the stopwatch. After 100 seconds, close the lever and record the second revolution with 3 hands.
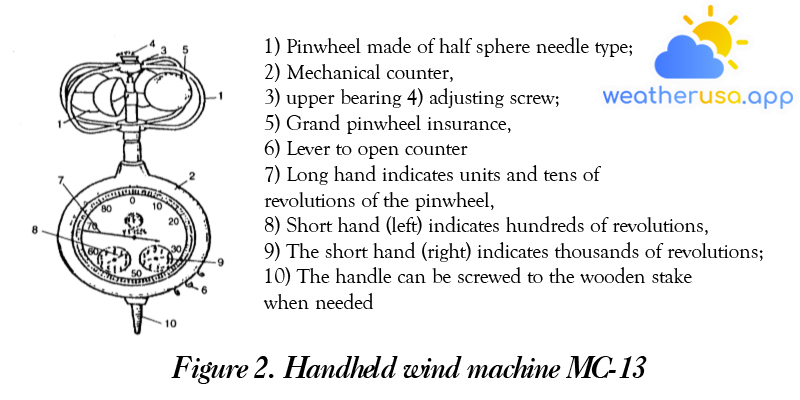
This meter should not be used to measure wind speeds over 20m/s. Over time, the friction between the shaft and the moving teeth is changed, so after 1-2 years of work, it is necessary to re-check the machine.
A stopwatch is always required when measuring with the simple wind machines mentioned above. To improve the accuracy of the monitoring data, it is necessary to complete several consecutive measurements in the shortest possible time; then take the average of those times.
Measure wind speed and apparent wind direction on boats
There will be no sea breeze if the boat goes against the actual wind direction with the same speed as the wind. If the ship is at rest, the wind is the sea breeze.
|
Wind level |
Wind level name |
Equivalent speed | The effect of wind | Wave height | |||
| kt | m/s | On the ground | Open sea | Windy | Normal | ||
| 1 | 2 | 3 | 4 | 5 | 6 | 7 | 8 |
| 0 | Quiet wind | <1 | 0-0,2 | Quiet wind, smoke straight up | The sea is as calm as a mirror | Quiet | – |
| 1 | Almost silent | 1-3 | 0,3-1,5 | The smoke represents wind direction, the wind not just the target wind direction | Ripple. Formed – formed wrinkles like fish scales, but no foam at all | Ordinary fishing boats feel vibrations | 0,1 |
| 2 | The wind is very light | 4-6 | 1,6-3,3 | Human faces see wind, leaves a little shake | Light waves, survival short, but the shape was more precise. Warhead is clear but not falling | If the fishing boat has a sad ocean every hour can go 2-3km every day thanks to the wind | 0,2 |
| 3 | The wind is quite light | Leaves and small branches It’s always hot, the wind opens the light ones | The waves are tiny. The wave head begins to fall, the foam has a square shape, and sometimes there are silver waves | The fishing boat is shaken, and every hour can be driven by the wind 5-6km | 0,6 | ||
| 4 | Gentle | Wind, sunshine, and loose dust sheets of paper up, and the branch shakes | The wave is small, and the wave becomes more extended, and there are many silver waves | When the wind blows, the sails can tilt the hull of the fishing boat | 0,1 | ||
| 5 | Medium wind | 17-21 | 8,0-10,7 | Small trees whose leaves begin to move. The water surface inland forms small waves with heads. | Medium waves. The waveform is markedly longer and has more silvery locks (may have water spray). | Fishing boats must reduce sails (miniature part of sails) | 2,0 |
| 6 | The wind is a bit strong | 22-27 | 10,8-13,8 | The great branch shook. Steel line “ringing,” difficult to open | Wave blades begin to form, white foamy wave heads extending in all directions (usually with water spray). | Fishing boats have to be rolled up to be twice as small, and fishing needs to be dangerous | 3,0 |
| 7 | Pretty strong wind | 28-33 | 13,9-17,1 | The whole tree shakes and dries up against the wind | The sea is rough; the white foam begins to be swept into the sea and follows the wind. | Transfer to berth at the pier or find a place to anchor in the sea | 4,0 |
| 8 | Strong wind | 34-40 | 17,2-20,7 | The wind breaks branches, which usually can’t go against the wind | The wave blade was moderately high and more extended, the streaks of water on the wavefront had begun to roll, and the foam was spreading in clear bands and oriented with the wind. | All fishing routes must return to the harbor | 5,5 |
| 9 | The wind is very strong | 41-47 | 20,8-24,4 | Wind damages houses, chimneys, and tiles | Large wave blades, dense foams in the direction of the wind. The tip of the wave blade begins to vibrate, fall and curl into a spray of water that can reduce visibility. | Ships are difficult to go | 7,0 |
| 10 | The wind is quite strong | 48-55 | 24,5-28,4 | Rarely found in the mainland, trees are uprooted, and houses are badly damaged. | The wave blade is large and has a long peak like a horse’s mane; the wind blows the foam forms in broad clusters and into solid white patches; generally, the water surface is almost white. Waveheads roll into intense and violent rolls, and horizontal visibility is reduced. | Quite dangerous for ships on the way. | 9,0 |
| 11 | Fierce wind | 56-63 | 28,5-32,6 | Very few, causing heavy damage | Exceptionally high wave blade. Long white foams cover the sea surface following the wind. The wind blows all sides of the wave crest, producing white foam-like soap bubbles. | Very dangerous for ships | 11,5 |
| 12 | The wind is very strong | 64-71 | 32,7-36,9 | Very rare in the land, extremely destructive power | The air pushed foam and spray, and the sea surface was white due to the spreading foam. Horizontal visibility is significantly reduced. | Ocean waves overwhelm the sky | 14,0 |
On ships, the apparent wind direction is determined by the opening of the flags on the mast and is measured by a compass. The wind direction is measured by the compass in degrees (with an accuracy of 10 deg ).
If there is no wind-measuring instrument, it can be assessed with the naked eye using the Beaufort wind scale (table 2).
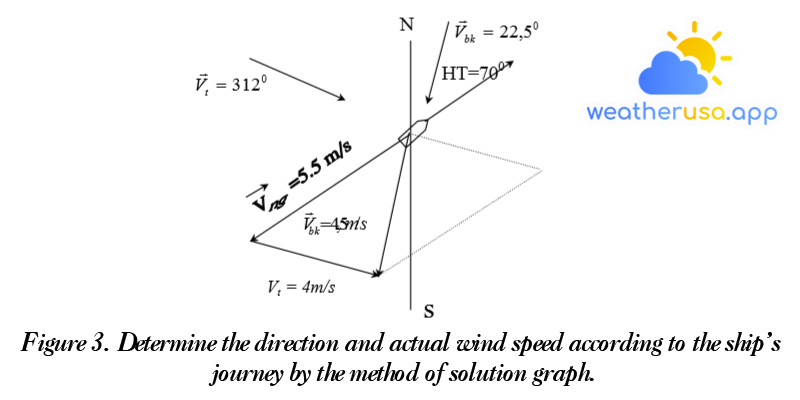
How to determine the actual wind.
The following two methods are commonly used to determine wind speed and direction.
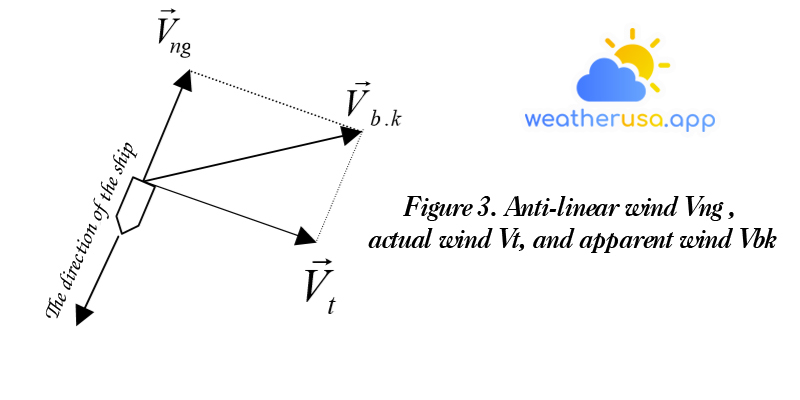
The graphical method is based on finding the difference between the apparent wind vector and the counter-linear wind . On paper, people draw the line NS (North-South) (Figure 3), on which point 0 is the center of the compass.
From the point of 0, line the sea wind vector (choose a reasonable ratio on it for the wind speed) and the upwind vector
(same speed ratio selected).
Then one determines the difference between the two vectors
The method of calculating natural wind by wind diagram (Figure 4). The wind diagram is a small round wooden board (can be made of cardboard or plastic) with checkered paper on the face.
A transparent, round plastic disc with graduated lines (from 0-360°) and the main directions marks on the edge are placed, which can rotate freely around the central axis of the wooden board.
At the handle of the wooden board, the top of the needle indicates the direction (other wind diagrams set the direction needle as long as the radius of the wooden base rotates around the central axis). To determine the natural wind by the graph, it is necessary to do the following:
Rotate the plastic disc so that the division or apparent wind direction (observed) coincides with the direction needle. From the center to the direction, needle mark point B a distance equal to the apparent wind speed with the appropriate scale.
(1cm = 1m/s or 0.5 cm = 1m/s ) (Figure 4 a )
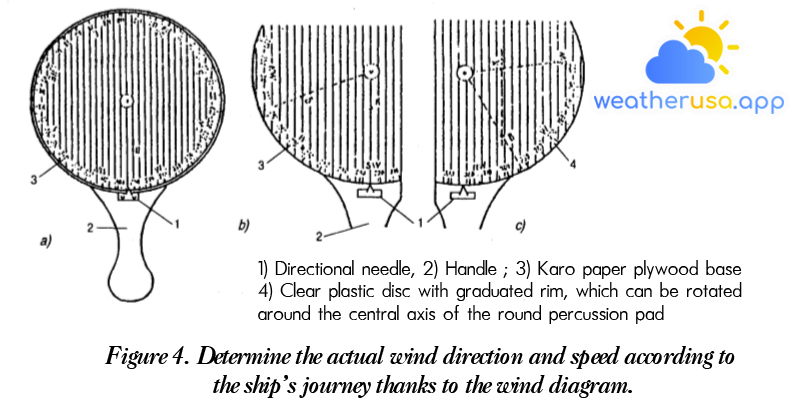
Rotate the disc so that the scale (or direction) on its rim coincides with the direction of the pointer corresponding to the direction of the train, and mark a point K at a distance from the center equal to the ship’s speed in direction center → pointer, choose the same scale as before (Figure 4b).
Rotate the plastic disc so that 2 points B and K are in the same direction with the vertical lines on the paper, paying attention to point K being higher than point B (Figure 4c).
The landmark on the graduated line opposite the needle shows the real wind direction, and the distance between the two points B and K is taken according to the selected ratio – the actual wind speed. The determination of wind on the wind diagram should not be too much, 1-2 minutes.
Local winds
Concept of local wind
The local wind does not always understand the meaning of “local.” In many cases, the local wind is part of the general atmospheric circulation (as part of the monsoon) but is still called the local wind because it has a defined weather character.
Local winds may result from very different buffer features, such as coastal patches or near large bodies of water, where land warming and cooling and water build-up—a local circulation (briz).
Or local topography also causes disturbances in the general atmospheric circulation in the form of changes in the direction of air currents that significantly increase wind speeds where the terrain is constricted or change the characteristics of the atmosphere. The air (like heat and moisture) is called the wind. Such winds can be found in many places with features of topographical origin, and all are named local winds.
So the local wind is the type of wind determined in a limited area; it shows the specific characteristics of that area’s geography.
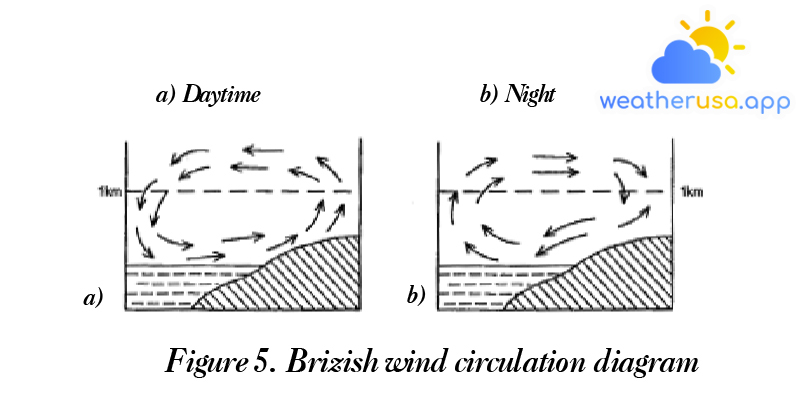
Briz wind
It occurs on the land near the coast with an evident half-day change of direction; During the day, it blows from the sea to the ground, and at night, from the land to the sea.
Bricose circulation is especially evident in the subtropical anticyclonic belt and the tropics. In the tropics, the bric wind speeds 5 -7 m/s and can deviate from the monsoon circulation.
If the brian wind has a direction that coincides with or nearly coincides with the monsoon direction, it will significantly increase the monsoon speed, and vice versa, it will decrease the rate.
Causes of the bricose circulation formation – the diurnal variation of heat on land. During the day, the ground is heated by the sun more intensely than the water, so the air here becomes thinner and lighter, and there is a decrease in pressure on the ground, making a gas flow from the sea surface go inland.
The land updraft of the air to an altitude of 1-2 km in the tropics to 3 km) will flow towards the sea, from where the air flows to the ground. Creates a closed double circulation. (fig. 5.a)
At night, when the ground heats up quickly and is colder than the sea, the lower air layer moves from the land to the sea, and the general picture will be opposite to the days. (Figure 5b)
The time it takes for a change in the direction of the brian wind to occur varies depending on the weather and local conditions. Still, usually, the movement from the sea (daytime) begins at 9-10 o’clock, and from the land – after the sun rises sunset.
Here the proper meaning of briss should be understood only in the lower part of the brisic circulation. Its vertical thickness is about 200-300 m in middle latitudes and 1-2 km in the tropics.
The bridge extends to the sea or the mainland no more than 30-40 km, and if the direction of the briz is opposite to the prevailing wind, the distance will be smaller.
Like the bristling wind, it is cyclical, and the cause of its formation is the mountain-valley wind. During the day, the wind direction from the plain or the sea blows to the valley, where the wind creeps up the mountainside leading to the formation of clouds on the slope. At night the wind blows from the mountains and valleys to the plains or the sea.
Wind gusts
Wind gusts are winds that blow from mountains and bring about a significant or sometimes extreme increase in heat temperature and a sharp decrease in the relative humidity of the air. In some places, this wind lasts from a few hours to a few days to several months.
The leading cause of wind formation is blocking the mountain ranges’ air currents. On the lee side of the mountain, the lower the air, the hotter it is (according to the law of adiabatic heating), and the relative humidity is slight because the amount of water vapor in the air stream has condensed to form clouds and precipitation on the windward side.
At sea, it is possible to encounter strong winds only near the coast; the terrain is high hills and mountains blocking the wind from the mainland to the sea.
The Bora wind is the name for the cold, storm-like force observed on the leeward side of low passes when cold air currents approach perpendicular to the mountain ranges that stand in their way.
When the vertical thickness is equal to the height of the access, the cold air from the windward side begins to rush up through the pass – that is, the phenomenon of the Bora wind appears.
Tornadoes – in the atmosphere when vortices have a vertical axis, like a tornado, but much smaller. A tornado appears in the sea on land called a tornado. Tornadoes often form in front of cumulus clouds, where the underlying gas is volatile, convection is intense, and a cold front crosses the temperature gradient large horizontal, facilitating the formation of a low-pressure gas column.
Starting from the front parts of the cumulus clouds, the vortex column gradually descends, the strong suction wind shakes the sea surface, and a dense layer of white water rises, slowly rising to the bottom of the cloud. The upper part of the tornado usually moves at a different speed than the lower part.
This causes the water column to gradually increase in inclination and become inactive until, after a few minutes, it breaks up about one-third of the height above sea level and eventually dissipates rapidly.
The hose life lasts 10 to 30 minutes, rarely exceeding half an hour. The tornado’s path is about tens of meters, the speed is passive, and the wind speed in the tornado is immense.
Water cannons are not dangerous for large ships, but they will be significantly destructive for small boats. However, it is still possible to see ahead with the naked eye or radar to find ways to prevent it.
Wind distribution on the globe
Wind characterization methods
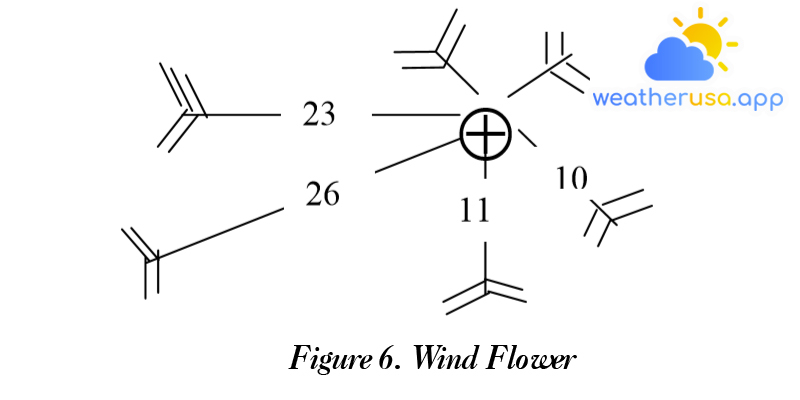
The windflower is used to visualize the wind regime in one place or another (or over an area). This descriptive method is entirely intuitive, allowing the determination of wind frequency by direction (usually in the eight principal directions) and its average speed, but large-scale maps are required. Such as in the Atlantic sea and ocean wind.
Wind Flower. (Figure 6) – is the diagram on which the central circle follows the eight principal directions at scale by convention. People plot wind frequency rays in a given direction to calculate a percentage of the total number of observations.
At the ends of the beams, through horizontal lines representing the average wind speed in the given advice, a horizontal line equal to 1 wind class is accepted. The small circle indicates the frequency of calm and weak winds.
According to the length of the ray, it is possible to predict the wind frequency of the given direction (the more significant the ray length, the greater the frequency).
The frequency quantity is recorded on the beam for winds above 12%. Sometimes for currents of less than 5% frequency, one will not draw rays.
Windflowers are established based on many years of monthly or seasonal observations for each point or individual plot of the sea.
Trending wind map. On these maps, arrows indicate the most common wind direction. That is denoted by the thickness of the arrows in grades 25-40, 40-60, 60-80% and greater than or equal to dashes, 1 dash -10% frequency.
These types of maps are made on small-scale maps, allowing to clarify the kind of wind prevailing, caused by the centers of permanent or seasonal atmospheric action, over any region of the globe. But these maps do not show wind speed.
Wind isometric maps – These are curves of the same wind speed. It is common to give lines with the same mean wind speed independent of direction.
At first glance, they indicate areas of strong winds and weak anniversaries. This type of map can be combined with prevailing wind maps.
Storm frequency map. On it, draw curves with the same wind frequency; for example, with winds greater than level 6, calculate a percentage of the total observations. They allow the recognition of storm zones for a given month or season.
Storm frequency lines can be plotted on prevailing wind maps but in the form of storm winds that do not frequently coincide with prevailing winds or are observable in other directions.
Wind distribution on the earth’s surface
The distribution of wind on the earth’s surface is closely related to the distribution of barometric pressure, and it is quite natural that the uneven distribution of pressure creates wind.
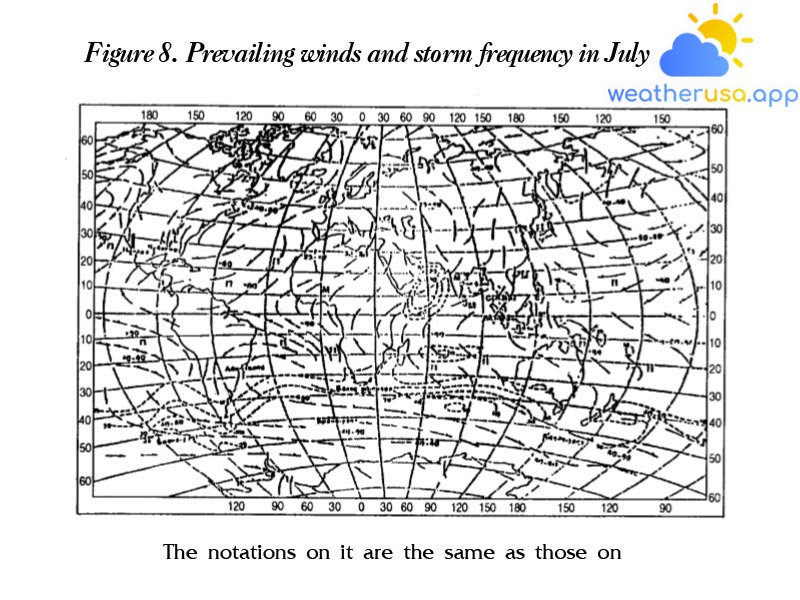
When comparing the barometric distribution maps with the prevailing wind maps (Figures 7 and 8), it is easy to see that year-round centers are kept the same over the oceans. Atmospheric effects also stabilize the wind regime (except for the northern part of the Indian Ocean, which is under the influence of the Greater Eurasian continent).
For the mainland, the characteristic seasonal impact centers corresponding to the wind regime are also seasonal on most continents (except Antarctica).
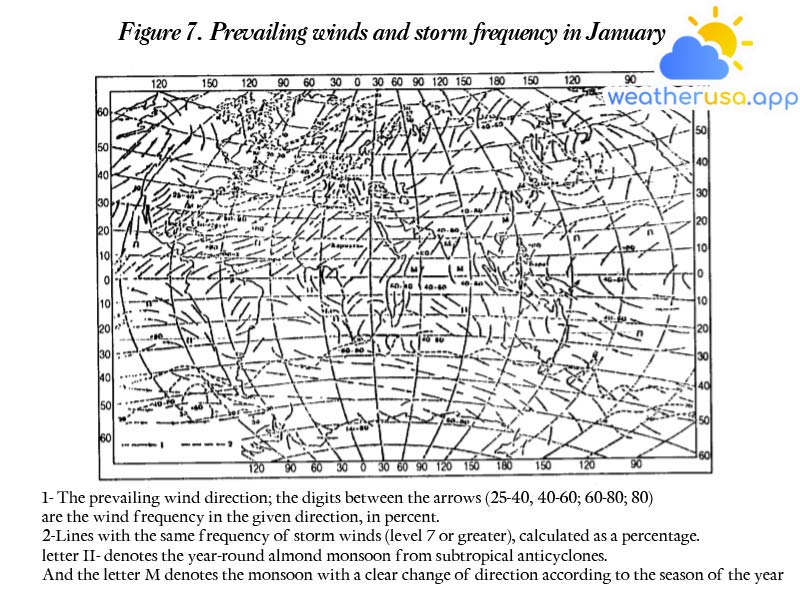
The tropical belt wind is the most stable throughout the year – the hot monsoon (on the map in Figures 7 and 8, denoted by the letter Π). The dry monsoon is a year-round wind from the subtropical anticyclones of the northern and southern hemispheres in the direction of the belt adjacent to the low-pressure equatorial belt.
In the northern hemisphere, the wind direction is east-north, and in the southern hemisphere, the direction is east-south. Together with the easterly direction, their frequency exceeds 80% by almost 100%.
The dry monsoon speed is also preserved as its direction and is in the range of 5-8 m/s, rarely reaching ten m/s.
On the equatorial belt of the low monsoon pressure, both hemispheres have an east direction (except for the Indian Ocean). They are slightly weak and often quiet, so this belt is often called a peaceful equatorial region. A substantial uplift of air occurs, developing large cumulus clouds and showers.
The width of the dry monsoon region in the northern and southern hemispheres (again excluding the north Indian Ocean) is about 2000 – 2500 km. In the east-south of all three oceans, the southern hemisphere winter reaches 3000 km.
Undeveloped cumulus clouds characterize the weather in these regions. At an altitude of 1.5 – 2 km, the monsoon inversion layer appears, resulting in the downflow of air in the upper layers, which is a property of all anticyclones.
In subtropical anticyclones over directionally unstable marginal wind oceans. For example, in January, in the Adop peak region, the wind direction SW, S, and SE, each direction has a frequency of 13 – 14%, NW 12%, and the remaining directions (W, N, NE, and E) – from 6 to 10 %.
From the subtropical anticyclones to the poles at latitudes 40-60°, both hemispheres have a dominant westerly wind zone potential (from NW to SW). Due to active cyclone activity at those latitudes, they are not as stable as the dry monsoon.
But it is the same ring that the wind is stronger than the monsoon in the North Atlantic average wind speed in January is 10-15m/s (level 6-7), and storm frequency is over 40%. North Pacific Ocean in winter, the frequency of storms (winds above level 7) reaches 30%.
Summer in the North Atlantic and Northern Pacific Ocean positive, associated with weakening cyclones Islan and ending Aleutian cyclones, winds become weaker in frequency storms decrease by 5-10%.
The westerly winds are especially evident in the southern hemisphere’s 40-60° latitudes, where continental influences do not disrupt them and where there are high wind speeds and regional storm frequencies up to 50%).
In the southern hemisphere’s higher latitudes near Antarctica’s coast, east-south and easterly winds prevail, on the one hand, due to the belt of low pressure at latitudes 60-70° and on the other hand due to anticyclones over the South icy year-round.
In the Northern Hemisphere, an easterly predominance at high latitudes is observed mainly in summer along the southern edge of the North Sea. It’s the seasonal wind. The type of wind associated with seasonal centers of atmospheric action is called the monsoon. They are characterized by a marked seasonal change in direction, either opposite or nearly opposite.
Monsoon is not everywhere clearly expressed. The most prominent are Southeast or South Asia, East Africa, the North Indian Ocean on the South China Sea, East China Sea. Here the wind frequency against the direction is over 60%.
In the northeast of the hemisphere, the Asian anticyclone develops, causing the northeast-northwest dry monsoon, which spreads to the western Indian Ocean south of the equator, close to Madagascar.
Winter winds bring dry India to some places. Summer on the hot continent of Asia has formed a low pressure with the leading center in the northern part of India. The wind prevails from the west – the south.
The summer monsoon blowing from the sea brings a large amount of moisture, causing heavy rainfall and partial flooding in South Asian countries.
Wind speed in winter (winter – north wind) is not more than 5-10 m/s; that is, winter wind, according to its location, direction, and speed, coincides with the monsoon in the northern hemisphere. The summer monsoon usually has a considerable wind speed. The frequency of storms in the Arabian Sea in June reached 50%.

Weather 01852 - Lowell MA

62°
scattered clouds
Feels like 60°05:36/19:47
64°F
/55°F
58%
1021 hPa
7 mi
9.22 mph


