Lake Ice
Climate Change Indicators: Lake Ice
Lake ice refers to the frozen surface layer of a lake. It forms when the lake’s water temperature drops below the freezing point and the surface freezes. The thickness of the lake ice can vary depending on the size and depth of the lake, as well as the temperature and weather conditions.
In colder climates, lake ice may become thick enough to support the weight of people, vehicles, and other objects. However, it is essential to exercise caution when venturing onto lake ice, as the thickness and stability of the ice can be challenging to determine and vary significantly even within a small area.
In colder climates, lake ice may become thick enough to support the weight of people, vehicles, and other objects. However, it is essential to exercise caution when venturing onto lake ice, as the thickness and stability of the ice can be challenging to determine and vary significantly even within a small area.
This indicator measures the time that ice has been present in lakes in the United States.
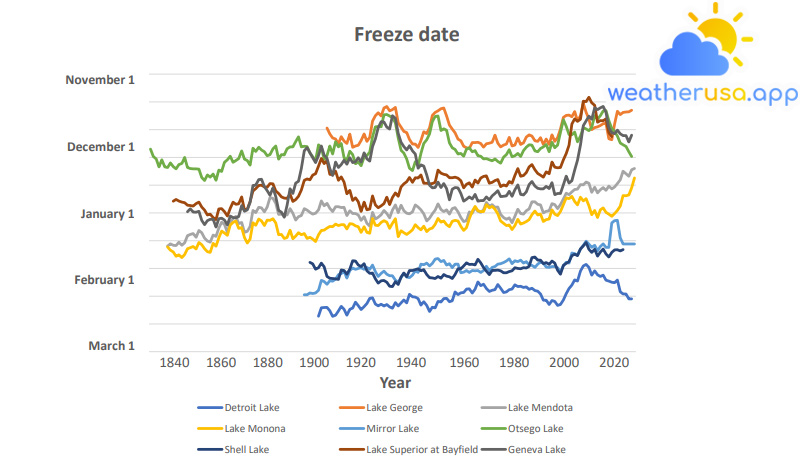
Figure 1. Date of First Freeze for Selected U.S. Lakes, 1850–2019

Figure 1. Date of First Freeze for Selected U.S. Lakes, 1850-2019
Data source: Various organizations
Web update: April 2021
Units: days from January 1
Data source: Various organizations
Web update: April 2021
Units: days from January 1
Figure 2. Thaw Date for Selected U.S. Lakes, 1840–2019
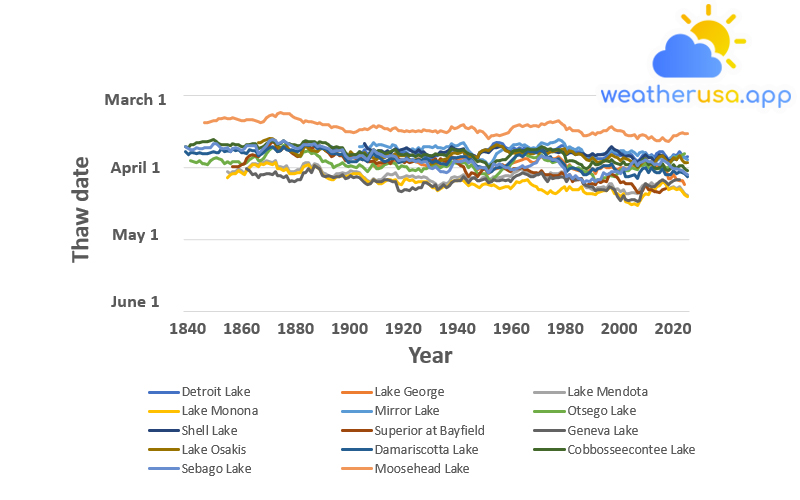
This figure shows the “icing” date, or ice melt and dispersal date, for 14 U.S. lakes. Data are corrected using the current and nine-year moving average from 1840 to 2019, depending on the lake.
Figure 2. Date of Ice Thaw for Selected U.S. Lakes, 1840-2019
Data source: Various organizations
Web update: April 2021
Units: days from January 1
Data source: Various organizations
Web update: April 2021
Units: days from January 1
Figure 3. Change in De-Ice Dates for Selected U.S. Lakes, 1905–2019
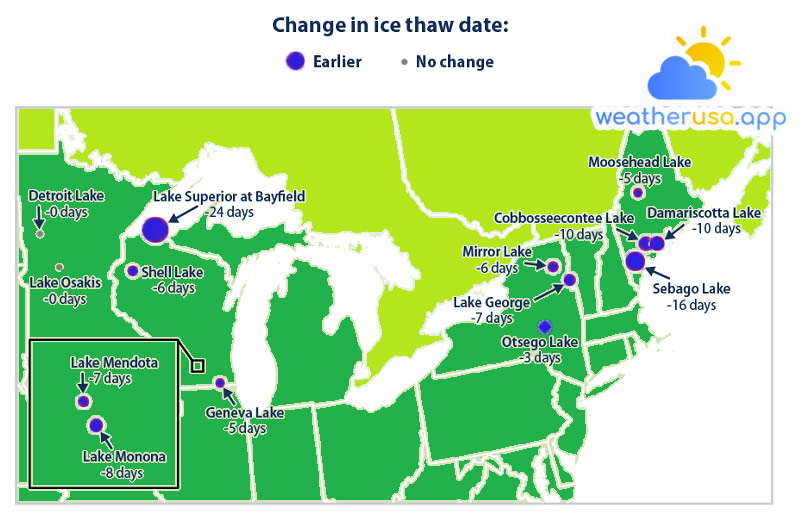
This figure shows the change in the “icing” date, or date of ice melt and dispersal, for 14 US lakes from 1905 to 2019.
Twelve lakes have red circles with negative numbers representing earlier thaw dates. Larger circles indicate more enormous changes. There was no change in the thaw dates in two of the lakes.
| Lake name | Lat | Long | Change in ice thaw date |
| Detroit Lake | 46.7833 | -95.9333 | 0 |
| Lake George | 43.8369 | -73.4306 | -6.90909 |
| Lake Mendota | 43.1 | -89.4 | -6.70588 |
| Lake Monona | 43.05 | -89.3667 | -8.44444 |
| Mirror Lake | 44.2889 | -73.9822 | -6.40449 |
| Otsego Lake | 42.75 | -74.8944 | -3.25714 |
| Shell Lake | 45.7333 | -91.9 | -5.92208 |
| Lake Superior at Bayfield | 46.81 | -90.81 | -24.4286 |
| Geneva | 42.57 | -88.5 | -4.95652 |
| Osakis | 45.89 | -95.1 | 0 |
| Damariscotta | 44.1825 | -69.4792 | -9.73171 |
| Cobbosseecontee | 44.255 | -69.9294 | -9.5 |
| Sebago | 43.8708 | -70.5669 | -15.907 |
| Moosehead | 45.6408 | -69.6658 | -5.18182 |
Figure 3. Change in Ice Thaw Dates for Selected U.S. Lakes, 1905-2019
Data source: Various organizations
Web update: April 2021
Units: days change from 1905 to 2019
Key Points
- Lakes covered by this indicator often freeze later than in the past. Freezing dates then slipped from roughly half a day to a day and a half in ten years (see Figure 1).
- Thaw dates for most of these lakes show a trend towards earlier ice breaking in the spring (see Figure 2). Spring thaw dates have grown as early as 24 days over the past 114 years (see Figure 3).
It was found that almost all of these lakes began to melt at the beginning of the year. - The changes in lake freeze and thaw dates shown here are consistent with other studies.
For example, long-term ice data from lakes and rivers across the Northern Hemisphere reveal that since the mid-1800s, freeze dates have occurred later, and thaw dates have occurred earlier, shifting from 0.8 days to one day per decade on average.
Background
- Ice cover formation on lakes in winter and its disappearance in the following spring depends on climatic factors such as air temperature, cloud cover, and wind.
Conditions upstream or elsewhere in the basin, such as heavy rains or snowmelt, also affect the freezing time of a lake. Therefore, ice formation and breaking dates are critical indicators of climate change.
If lakes stay frozen more extended, it could indicate climate cooling. Conversely, shorter periods of ice cover indicate a warming climate. - Ice cover changes can affect a water body’s physical, chemical, and biological properties. For example, ice affects heat and moisture transfers between a lake and the atmosphere.
Decreased ice cover leads to increased evaporation and lower water levels, as well as an increase in water temperature and sunlight penetration. These changes, in turn, can affect plant and animal life cycles and the availability of suitable habitats.
In addition, the ice cover affects the amount of heat reflected from the Earth’s surface. Exposed water will absorb and retain heat, making the Earth’s surface warmer, while a lake covered in ice and snow will reflect more and drink less of the sun’s energy. - The timing and duration of ice cover on lakes and other bodies of water can also affect society – particularly concerning shipping and transportation, hydroelectric power generation, and fishing.
Effects can be positive or negative. For example, decreasing ice cover on a large lake may prolong the offshore shipping season.
Still, it may require ships to reduce their cargo capacity as increased evaporation leads to lower water levels.
About the Indicator
- This indicator analyzes the freezing and thawing dates of lakes. Frost dates occur when a continuous, motionless blanket of ice forms over a body of water. Thaw dates happen when the ice sheet breaks and open water expands.
- Human visual observations have recorded freezing and thawing dates for over 150 years. The National Snow and Ice Data Center maintain a database of freeze and thaw observations from more than 850 lakes and rivers throughout the Northern Hemisphere.
This indicator focuses on the 14 lakes with the longest and most complete historical records in the United States. Lakes of interest are located in Minnesota, Wisconsin, New York, and Maine.
About the Data
Indicator Notes
- While there is a long historical record of freeze and thaw dates for a much larger group of lakes and rivers, some records are missing, with interruptions ranging from short jumps to significant data gaps.
This indicator is limited to 14 lakes with sufficiently complete historical records. The four Maine lakes and Lake Osakis only have data on ice melt, so they are not visible in Figure 1. - All of the data used in this indicator is based on visual observations. While procedures for observing lake ice have been consistent over time, visual statements by individuals are open to some interpretation and may differ from person to person.
Additionally, historical observations of lakes were typically made from a specific point on the shore; this may not be representative of the lakes as a whole or comparable to satellite-based words.
The issues of determining the thaw date are specific to each lake.
Data Sources
Data up to 2004 for most lakes were obtained from the Global Database of Lake, and River Ice Phenology maintained by the National Snow and Ice Data Center.
More recent data has been obtained from state, local, and other organizations that collect or compile observations.
More recent data has been obtained from state, local, and other organizations that collect or compile observations.

Weather 01852 - Lowell MA

54°
clear sky
Feels like 50°05:46/19:39
57°F
/49°F
27%
1031 hPa
7 mi
4 mph


