
Heavy Precipitation
Heavy Precipitation
| Year | Index value | 9-year moving average |
| 1910 | 0.09 | 0.10466 |
| 1911 | 0.151 | 0.110684 |
| 1912 | 0.103 | 0.113895 |
| 1913 | 0.077 | 0.117645 |
| 1914 | 0.167 | 0.120289 |
| 1915 | 0.135 | 0.114098 |
| 1916 | 0.093 | 0.099379 |
| 1917 | 0.045 | 0.088074 |
| 1918 | 0.086 | 0.088289 |
| 1919 | 0.12 | 0.095527 |
| 1920 | 0.088 | 0.102152 |
| 1921 | 0.116 | 0.105922 |
| 1922 | 0.099 | 0.106277 |
| 1923 | 0.132 | 0.100938 |
| 1924 | 0.086 | 0.091 |
| 1925 | 0.047 | 0.082883 |
| 1926 | 0.095 | 0.080094 |
| 1927 | 0.092 | 0.07868 |
| 1928 | 0.068 | 0.074512 |
| 1929 | 0.068 | 0.069586 |
| 1930 | 0.059 | 0.069273 |
| 1931 | 0.062 | 0.076297 |
| 1932 | 0.085 | 0.086453 |
| 1933 | 0.143 | 0.091508 |
| 1934 | 0.065 | 0.089707 |
| 1935 | 0.064 | 0.088332 |
| 1936 | 0.106 | 0.091758 |
| 1937 | 0.1 | 0.094406 |
| 1938 | 0.12 | 0.090004 |
| 1939 | 0.051 | 0.081387 |
| 1940 | 0.069 | 0.076289 |
| 1941 | 0.077 | 0.076965 |
| 1942 | 0.092 | 0.078742 |
| 1943 | 0.077 | 0.077352 |
| 1944 | 0.074 | 0.073336 |
| 1945 | 0.061 | 0.0695 |
| 1946 | 0.074 | 0.067375 |
| 1947 | 0.057 | 0.067242 |
| 1948 | 0.077 | 0.069988 |
| 1949 | 0.053 | 0.076586 |
| 1950 | 0.1 | 0.085488 |
| 1951 | 0.107 | 0.093453 |
| 1952 | 0.077 | 0.099285 |
| 1953 | 0.123 | 0.102855 |
| 1954 | 0.099 | 0.101262 |
| 1955 | 0.129 | 0.091711 |
| 1956 | 0.042 | 0.077965 |
| 1957 | 0.068 | 0.068512 |
| 1958 | 0.049 | 0.06809 |
| 1959 | 0.089 | 0.074625 |
| 1960 | 0.07 | 0.083059 |
| 1961 | 0.104 | 0.088992 |
| 1962 | 0.11 | 0.091367 |
| 1963 | 0.049 | 0.093348 |
| 1964 | 0.125 | 0.097055 |
| 1965 | 0.098 | 0.098836 |
| 1966 | 0.117 | 0.094313 |
| 1967 | 0.066 | 0.085348 |
| 1968 | 0.078 | 0.077969 |
| 1969 | 0.062 | 0.075543 |
| 1970 | 0.088 | 0.076789 |
| 1971 | 0.076 | 0.079398 |
| 1972 | 0.075 | 0.082453 |
| 1973 | 0.093 | 0.084676 |
| 1974 | 0.097 | 0.084348 |
| 1975 | 0.072 | 0.082664 |
| 1976 | 0.064 | 0.083031 |
| 1977 | 0.113 | 0.086875 |
| 1978 | 0.071 | 0.094156 |
| 1979 | 0.094 | 0.104762 |
| 1980 | 0.141 | 0.115156 |
| 1981 | 0.125 | 0.118602 |
| 1982 | 0.129 | 0.112484 |
| 1983 | 0.087 | 0.102344 |
| 1984 | 0.082 | 0.096457 |
| 1985 | 0.087 | 0.096969 |
| 1986 | 0.131 | 0.098492 |
| 1987 | 0.088 | 0.097234 |
| 1988 | 0.084 | 0.097285 |
| 1989 | 0.077 | 0.102551 |
| 1990 | 0.155 | 0.107727 |
| 1991 | 0.117 | 0.106172 |
| 1992 | 0.063 | 0.102625 |
| 1993 | 0.1 | 0.108594 |
| 1994 | 0.113 | 0.127316 |
| 1995 | 0.162 | 0.149797 |
| 1996 | 0.21 | 0.164551 |
| 1997 | 0.135 | 0.166516 |
| 1998 | 0.196 | 0.156293 |
| 1999 | 0.151 | 0.137891 |
| 2000 | 0.07 | 0.11982 |
| 2001 | 0.114 | 0.110184 |
| 2002 | 0.114 | 0.109574 |
| 2003 | 0.108 | 0.11477 |
| 2004 | 0.1 | 0.124727 |
| 2005 | 0.168 | 0.138055 |
| 2006 | 0.131 | 0.150023 |
| 2007 | 0.182 | 0.155523 |
| 2008 | 0.176 | 0.154145 |
| 2009 | 0.092 | 0.15052 |
| 2010 | 0.194 | 0.147637 |
| 2011 | 0.142 | 0.144246 |
| 2012 | 0.117 | 0.141531 |
| 2013 | 0.149 | 0.144477 |
| 2014 | 0.128 | 0.154082 |
| 2015 | 0.209 | 0.165031 |
| 2016 | 0.146 | 0.171324 |
| 2017 | 0.196 | 0.168871 |
| 2018 | 0.175 | 0.15475 |
| 2019 | 0.136 | 0.130621 |
| 2020 | 0.078 | 0.10525 |
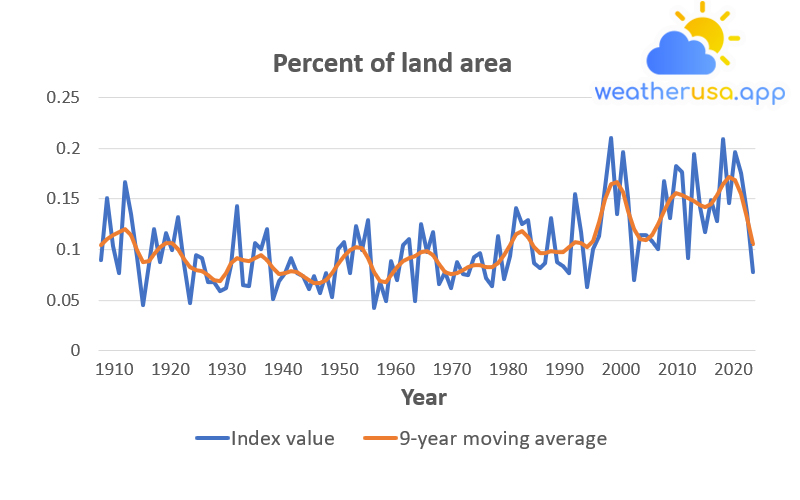
Figure 1. Extreme One-Day Precipitation Events in the Contiguous 48 States, 1910-2020
Data source: NOAA, 2021
Web update: April 2021
Units: percent of land area
The thicker line shows the nine-year weighted average and smoothes out some year-to-year fluctuations.
| Year | Fraction of Area >=2.0 | 9-yr Moving Average |
| 1895 | 0 | 0.00359 |
| 1896 | 0.010258 | 0.005517 |
| 1897 | 0.012304 | 0.005812 |
| 1898 | 0 | 0.004728 |
| 1899 | 0 | 0.004129 |
| 1900 | 0.005236 | 0.004832 |
| 1901 | 0.01014 | 0.005826 |
| 1902 | 0.006461 | 0.007227 |
| 1903 | 0.001634 | 0.012037 |
| 1904 | 0 | 0.021615 |
| 1905 | 0.068688 | 0.030629 |
| 1906 | 0.042507 | 0.031934 |
| 1907 | 0.016181 | 0.025686 |
| 1908 | 0.008524 | 0.017846 |
| 1909 | 0.02358 | 0.011851 |
| 1910 | 0 | 0.007389 |
| 1911 | 0 | 0.004595 |
| 1912 | 0.005511 | 0.005247 |
| 1913 | 0 | 0.010665 |
| 1914 | 0.00626 | 0.018311 |
| 1915 | 0.073127 | 0.02169 |
| 1916 | 0 | 0.017932 |
| 1917 | 0 | 0.01252 |
| 1918 | 0 | 0.011038 |
| 1919 | 0.039175 | 0.011626 |
| 1920 | 0.001323 | 0.011133 |
| 1921 | 0 | 0.011686 |
| 1922 | 0.003625 | 0.014998 |
| 1923 | 0.057772 | 0.017086 |
| 1924 | 0 | 0.015496 |
| 1925 | 0 | 0.015334 |
| 1926 | 0 | 0.020842 |
| 1927 | 0.077311 | 0.02705 |
| 1928 | 0.010377 | 0.026587 |
| 1929 | 0.031216 | 0.019367 |
| 1930 | 0 | 0.010879 |
| 1931 | 0 | 0.005406 |
| 1932 | 0.002453 | 0.003478 |
| 1933 | 0.007398 | 0.003367 |
| 1934 | 0 | 0.003572 |
| 1935 | 0.005118 | 0.003864 |
| 1936 | 0.003408 | 0.004401 |
| 1937 | 0.005035 | 0.005744 |
| 1938 | 0.009048 | 0.011936 |
| 1939 | 0 | 0.029512 |
| 1940 | 0.004605 | 0.0547 |
| 1941 | 0.232839 | 0.067836 |
| 1942 | 0.0122 | 0.05586 |
| 1943 | 0 | 0.031548 |
| 1944 | 0.003378 | 0.015498 |
| 1945 | 0.021692 | 0.012439 |
| 1946 | 0.001132 | 0.015245 |
| 1947 | 0.031163 | 0.017745 |
| 1948 | 0.026306 | 0.017927 |
| 1949 | 0 | 0.016847 |
| 1950 | 0.020227 | 0.015861 |
| 1951 | 0.028465 | 0.014216 |
| 1952 | 0 | 0.011198 |
| 1953 | 0.00651 | 0.008274 |
| 1954 | 0.011262 | 0.007751 |
| 1955 | 0 | 0.011324 |
| 1956 | 0 | 0.017878 |
| 1957 | 0.072896 | 0.02213 |
| 1958 | 0.000191 | 0.020134 |
| 1959 | 0.014896 | 0.01462 |
| 1960 | 0.002604 | 0.010484 |
| 1961 | 0.017222 | 0.00922 |
| 1962 | 0.002506 | 0.010751 |
| 1963 | 0 | 0.014717 |
| 1964 | 0.044332 | 0.017902 |
| 1965 | 0.022344 | 0.016364 |
| 1966 | 0 | 0.011028 |
| 1967 | 0.001017 | 0.006275 |
| 1968 | 0.009609 | 0.004016 |
| 1969 | 0 | 0.003584 |
| 1970 | 0.002096 | 0.005905 |
| 1971 | 0 | 0.013051 |
| 1972 | 0.016736 | 0.023089 |
| 1973 | 0.077385 | 0.029616 |
| 1974 | 0 | 0.029055 |
| 1975 | 0.041739 | 0.025391 |
| 1976 | 0.00335 | 0.025307 |
| 1977 | 0.015327 | 0.029674 |
| 1978 | 0.079869 | 0.03179 |
| 1979 | 0.022044 | 0.027015 |
| 1980 | 0 | 0.022855 |
| 1981 | 0 | 0.031395 |
| 1982 | 0.026827 | 0.049607 |
| 1983 | 0.187861 | 0.058304 |
| 1984 | 0 | 0.046966 |
| 1985 | 0.003026 | 0.026781 |
| 1986 | 0.020797 | 0.012626 |
| 1987 | 0 | 0.007472 |
| 1988 | 0 | 0.008638 |
| 1989 | 0.004776 | 0.014306 |
| 1990 | 0.039153 | 0.021581 |
| 1991 | 0.028722 | 0.027318 |
| 1992 | 0.011331 | 0.030583 |
| 1993 | 0.071261 | 0.032075 |
| 1994 | 0 | 0.033938 |
| 1995 | 0.026657 | 0.038041 |
| 1996 | 0.089272 | 0.042082 |
| 1997 | 0.005546 | 0.041234 |
| 1998 | 0.074667 | 0.03355 |
| 1999 | 0.006048 | 0.021613 |
| 2000 | 0 | 0.0112 |
| 2001 | 0 | 0.00806 |
| 2002 | 0 | 0.013155 |
| 2003 | 0.032114 | 0.021105 |
| 2004 | 0.047239 | 0.025043 |
| 2005 | 0.014068 | 0.023734 |
| 2006 | 0.010911 | 0.022062 |
| 2007 | 0.022141 | 0.02412 |
| 2008 | 0.035476 | 0.029645 |
| 2009 | 0.03182 | 0.036865 |
| 2010 | 0.028971 | 0.042994 |
| 2011 | 0.100413 | 0.043494 |
| 2012 | 0.004228 | 0.037815 |
| 2013 | 0.034228 | 0.032757 |
| 2014 | 0 | 0.033563 |
| 2015 | 0.091272 | 0.037919 |
| 2016 | 0.013336 | 0.044622 |
| 2017 | 0.01561 | 0.057096 |
| 2018 | 0.115255 | 0.07159 |
| 2019 | 0.119515 | 0.075971 |
| 2020 | 0.042939 | 0.06663 |
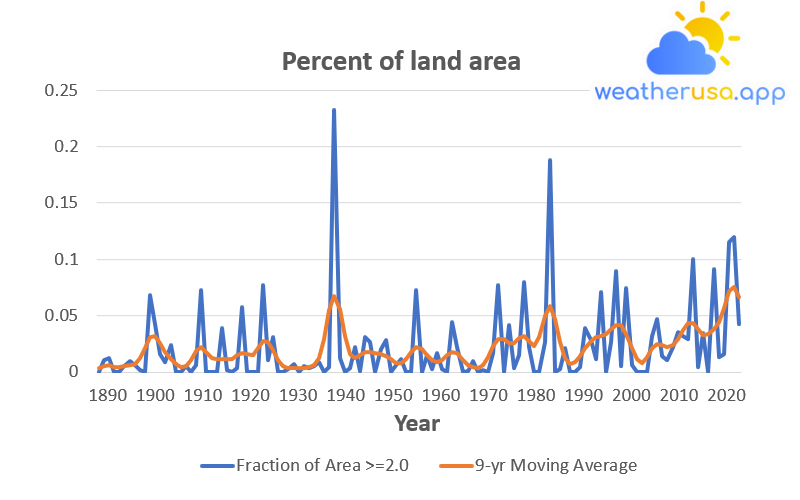
Figure 2. Unusually High Annual Precipitation in the Contiguous 48 States, 1895-2020
Data source: NOAA, 2021
Web update: April 2021
Units: percent of land area
Key points
- In recent years, a more significant percentage of precipitation has come from extreme single-day events. Nine of the first ten years for extreme one-day precipitation events have occurred since 1996 (see Figure 1).
- The prevalence of extreme single-day precipitation events remained relatively constant between 1910 and the 1980s but has increased significantly since then.
During the entire period from 1910 to 2020, the portion of the country that experienced extreme single-day precipitation events increased at a rate of about half a percentage point per decade (see Figure 1). - Between 1895 and 2020, the percentage of land areas receiving much more than the typical annual total precipitation increased. However, there has been a lot of variability from year to year.
Some years had no abnormally wet areas, while other several years had abnormally high precipitation totals of more than 10 percent or more of the land area of the 48 contiguous states (see Figure 2). For example, 1941 was extremely rainy in the West, while 1982 was very wet nationwide. - Figures 1 and 2 are consistent with other studies that found increased heavy precipitation over periods ranging from odd days to seasons and years.
For more information on trends in overall precipitation levels, see the USA and Look at the Global Precipitation indicator.
Background
“Heavy precipitation” refers to situations where the amount of rain or snow experienced in a place is significantly higher than usual. What constitutes a period of heavy rainfall varies by location and season.
Climate change can affect precipitation intensity and frequency. Warmer oceans increase the amount of water that evaporates into the air. When more moisture-laden air moves over land or converges into a storm system, it can result in heavier precipitation (for example, more heavy rain and snowstorms).
The potential effect of heavy rainfall includes crop damage, soil erosion, and increased air pollution. The risk of flooding from heavy rains can lead to injuries, drowning, and other health-related effects. In addition, runoff from rainfall can degrade water quality as land-washed pollutants accumulate in water bodies.
However, changes in precipitation intensity, combined with changes in the interval between precipitation events, can also lead to changes in overall precipitation totals.
About the Indicator
- Heavy precipitation events can be measured by tracking their frequency, examining return times, or measuring the amount of precipitation over a given period.
- One way to track heavy precipitation is to calculate the percent of the total rainfall for a given location in a given year as extreme one-day events. In other words, what percentage of the precipitation comes in short, intense bursts.
Figure 1 of this indicator looks at the prevalence of extreme single-day precipitation events over time.
- For more information, this indicator also tracks an unusually high total annual precipitation occurrence. It does this by looking at the Standardized Precipitation Index, which compares yearly actual precipitation totals with the range of precipitation totals that can typically be expected at a given location based on historical data.
Suppose a site receives less than usual rainfall during a given period. In that case, it will receive a negative SPI score, while a location that receives more rain than usual will receive a positive score. The more precipitation, the higher the SPI score.
SPI is a valuable way to look at precipitation totals as it allows different locations and seasons to be compared on a standard scale. Figure 2 shows what percentage of the total area of the 48 contiguous states has an annual SPI score of 2.
About the Data
Indicator Notes

Weather 01852 - Lowell MA

48°
light rain
Feels like 46°05:32/19:50
50°F
/47°F
82%
1019 hPa
6 mi
4.61 mph


