Heat Waves
Heat Waves
Temperatures that people from warmer climates consider normal can be called heat waves in a colder area if they are outside the typical climate pattern for that area.
Climate Change Indicators: Heat Waves
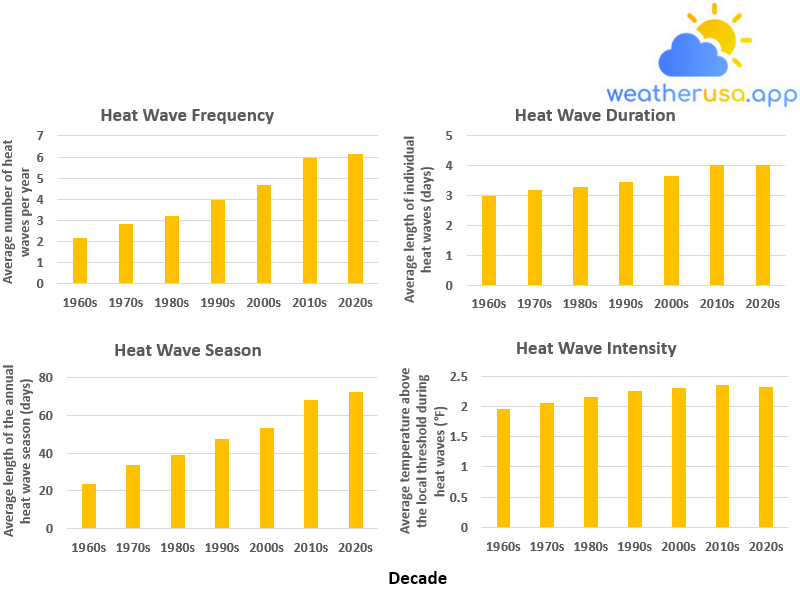
Figure 1. Heat Wave Characteristics in the United States by Decade, 1961–2021

This figure shows the evolution of the number of heat waves per year; the average duration of heat waves in days; the number of days between the first and the last heat wave of the year; and the heat of the heat waves compared to the local temperature threshold to define a heat wave.
These data were analyzed from 1961 to 2021 for 50 large metropolitan areas. The graphs show the averages of the 50 urban areas by decade.
| Decade | Frequency (average number of heat waves per year) | Duration (average number of individual heat waves) | Season (average length of annual heat wave season) | Intensity (average temperature above local threshold during heat waves) |
| 1960s | 2.172 | 3.003418 | 23.75 | 1.949738 |
| 1970s | 2.842 | 3.206548 | 33.97 | 2.063236 |
| 1980s | 3.216 | 3.29976 | 38.81 | 2.15336 |
| 1990s | 3.956 | 3.466631 | 47.512 | 2.25061 |
| 2000s | 4.668 | 3.654336 | 53.498 | 2.297838 |
| 2010s | 5.964 | 4.044645 | 68.518 | 2.36048 |
| 2020s | 6.14 | 4.034601 | 72.68 | 2.322827 |
Figure 1. Heat Wave Characteristics in the United States by Decade, 1961–2021
Data source: NOAA, 2022
Web update: July 2022
Units: number of heat waves; length of heat waves (days); length of heat wave season (days); °F
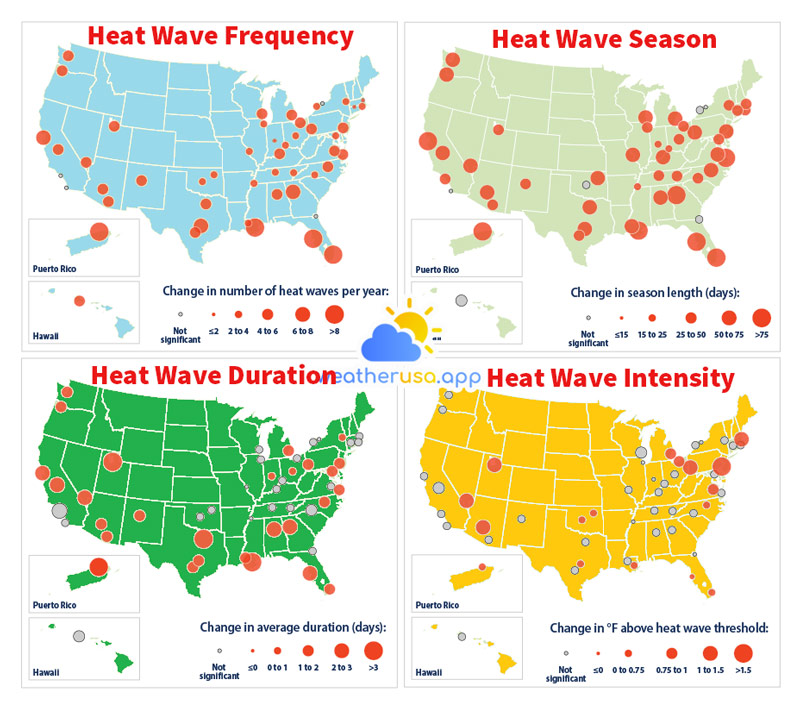
These data were analyzed from 1961 to 2021 for 50 large metropolitan areas. The size of each circle indicates the total variation over the measured period. Solid-colored circles represent cities where the trend was statistically significant.
| Station | Latitude | Longitude | Frequency Change | Duration Change | Season Change | Intensity Change |
| ALBANY_NY | 42.75 | -73.8 | 3.182443 | 0.922206 | 37.7578 | 0.498143 |
| ALBUQUERQUE_NM | 35.05 | -106.62 | 4.080381 | 1.156348 | 40.02961 | 0.23716 |
| ATLANTA_GA | 33.65 | -84.43 | 6.212586 | 2.241648 | 85.37388 | 0.409455 |
| AUSTIN_TX | 30.3 | -97.7 | 6.942359 | 1.361569 | 62.35748 | 0.418575 |
| BALTIMORE_MD | 39.18 | -76.67 | 3.915389 | 1.030942 | 46.51507 | 0.709783 |
| BATON_ROUGE_LA | 30.53 | -91.15 | 3.861449 | 1.202755 | 53.78741 | 0.16557 |
| BIRMINGHAM_AL | 33.57 | -86.75 | 5.530407 | 2.500855 | 67.46272 | 0.492552 |
| BOSTON_MA | 42.37 | -71.03 | 1.830777 | 0.667505 | 28.53094 | 1.254814 |
| BUFFALO_NY | 42.93 | -78.73 | 2.525648 | 0.338473 | 19.71338 | 0.370466 |
| CHARLOTTE_NC | 35.22 | -80.93 | 3.575886 | 1.360237 | 44.12586 | 0.362877 |
| CHICAGO_IL | 41.78 | -87.75 | 3.350608 | 0.128501 | 46.38498 | -0.4263 |
| CLEVELAND_OH | 41.4 | -81.85 | 5.355896 | 0.683032 | 48.15547 | 0.846733 |
| COLUMBUS_OH | 40 | -82.88 | 3.594923 | 0.872303 | 47.9175 | 0.74362 |
| COVINGTON_KY | 39.07 | -84.67 | 2.236912 | 0.462915 | 23.86991 | 0.174406 |
| DETROIT_MI | 42.42 | -83.02 | 5.758858 | 1.142514 | 54.77419 | 0.83671 |
| FORT_WORTH_TX | 32.83 | -97.05 | 4.902168 | 3.707752 | 55.19302 | 0.483303 |
| FRESNO_CA | 36.77 | -119.72 | 4.362771 | 2.213152 | 66.97409 | 0.778161 |
| HARTFORD_CT | 41.93 | -72.68 | 1.634056 | 0.13007 | 27.13802 | 0.40141 |
| HONOLULU_HI | 21.33 | -157.92 | 5.622422 | 1.775997 | 47.81914 | 0.315821 |
| INDIANAPOLIS_IN | 39.73 | -86.28 | 1.824432 | 0.932072 | 24.11105 | -0.18958 |
| JACKSONVILLE_FL | 30.5 | -81.7 | 0.996298 | 0.342432 | 20.90005 | -0.03682 |
| KNOXVILLE_TN | 35.82 | -83.98 | 3.556848 | 0.569831 | 47.64463 | 0.297246 |
| LAS_VEGAS_NV | 36.08 | -115.17 | 5.746166 | 2.981493 | 61.15177 | 1.174505 |
| LOS_ANGELES_CA | 33.93 | -118.4 | 0.999471 | 2.543069 | 29.28926 | 0.501711 |
| LOUISVILLE_KY | 38.18 | -85.73 | 4.892649 | 0.897163 | 50.96351 | 0.145496 |
| MEMPHIS_TN | 35.05 | -89.98 | 2.522475 | -0.84148 | 20.4146 | -0.35357 |
| MIAMI_FL | 25.8 | -80.27 | 8.852459 | 1.433866 | 82.25172 | 0.338878 |
| MILWAUKEE_WI | 42.95 | -87.9 | 4.080381 | 0.408456 | 50.60497 | 0.948615 |
| NASHVILLE_TN | 36.12 | -86.68 | 3.172924 | 0.670081 | 37.76415 | 0.244342 |
| NEW_ORLEANS_LA | 29.98 | -90.25 | 9.055526 | 4.129092 | 102.5806 | 0.632466 |
| NORFOLK_VA | 36.9 | -76.2 | 5.920677 | 1.710693 | 75.31888 | 0.428747 |
| OKLAHOMA_CITY_OK | 35.4 | -97.6 | 2.144897 | 0.135713 | 22.1597 | 0.698864 |
| PHILADELPHIA_PA | 39.88 | -75.25 | 4.521417 | 1.692348 | 52.25806 | 1.509821 |
| PHOENIX_AZ | 33.43 | -112.02 | 5.352723 | 1.749148 | 58.18191 | 1.069157 |
| PITTSBURGH_PA | 40.5 | -80.22 | 4.115283 | 1.117904 | 58.19778 | 1.433639 |
| PORTLAND_OR | 45.6 | -122.6 | 5.279746 | 1.101745 | 57.47118 | 0.646406 |
| PROVIDENCE_RI | 41.73 | -71.43 | 2.852459 | 0.382778 | 31.31359 | 0.410295 |
| RALEIGH_NC | 35.87 | -78.78 | 5.346378 | 1.715923 | 64.17874 | 0.72915 |
| RICHMOND_VA | 37.5 | -77.33 | 4.045479 | 0.921881 | 58.36594 | 0.875282 |
| ROCHESTER_NY | 43.12 | -77.67 | 1.154944 | -0.3986 | 9.636171 | -0.22777 |
| SALT_LAKE_CITY_UT | 40.77 | -111.97 | 4.753041 | 3.390715 | 48.90428 | 1.341896 |
| SAN_ANTONIO_TX | 29.53 | -98.47 | 4.956108 | 1.421069 | 49.77366 | 0.091336 |
| SAN_DIEGO_CA | 32.73 | -117.17 | 1.180328 | 0.300123 | 13.60867 | 0.283486 |
| SAN_FRANCISCO_CA | 37.62 | -122.38 | 6.793231 | 2.897614 | 111.4268 | 0.205518 |
| SAN_JUAN_PR | 18.43 | -66 | 14.25278 | 1.369659 | 134.6843 | 0.303653 |
| SEATTLE_WA | 47.45 | -122.3 | 4.508726 | 1.961303 | 56.89371 | 0.36543 |
| ST_LOUIS_MO | 38.75 | -90.38 | 3.937599 | -0.60269 | 52.77525 | 0.48518 |
| TAMPA_FL | 27.97 | -82.53 | 9.639344 | 2.039686 | 92.34479 | 0.516167 |
| TUCSON_AZ | 32.12 | -110.93 | 5.359069 | 1.706698 | 49.30407 | 0.488453 |
| TULSA_OK | 36.2 | -95.9 | 3.398202 | 0.96528 | 50.62401 | 0.588124 |
Data source: NOAA, 2022
Web update: July 2022
Units: degrees; degrees; number of heat waves; length of heat waves (days); length of heat wave season (days); °F
| Year | Heatwave index |
| 1890 | |
| 1891 | |
| 1892 | |
| 1893 | |
| 1894 | |
| 1895 | 0.034 |
| 1896 | 0.089 |
| 1897 | 0.166 |
| 1898 | 0.054 |
| 1899 | 0.043 |
| 1900 | 0.124 |
| 1901 | 0.328 |
| 1902 | 0.052 |
| 1903 | 0.001 |
| 1904 | 0.006 |
| 1905 | 0.037 |
| 1906 | 0.027 |
| 1907 | 0.019 |
| 1908 | 0.023 |
| 1909 | 0.043 |
| 1910 | 0.051 |
| 1911 | 0.204 |
| 1912 | 0.033 |
| 1913 | 0.097 |
| 1914 | 0.105 |
| 1915 | 0.03 |
| 1916 | 0.145 |
| 1917 | 0.182 |
| 1918 | 0.238 |
| 1919 | 0.026 |
| 1920 | 0.004 |
| 1921 | 0.139 |
| 1922 | 0.004 |
| 1923 | 0.024 |
| 1924 | 0.032 |
| 1925 | 0.159 |
| 1926 | 0.058 |
| 1927 | 0.008 |
| 1928 | 0.046 |
| 1929 | 0.02 |
| 1930 | 0.524 |
| 1931 | 0.572 |
| 1932 | 0.118 |
| 1933 | 0.199 |
| 1934 | 0.898 |
| 1935 | 0.166 |
| 1936 | 1.338 |
| 1937 | 0.063 |
| 1938 | 0.035 |
| 1939 | 0.09 |
| 1940 | 0.221 |
| 1941 | 0.185 |
| 1942 | 0.067 |
| 1943 | 0.066 |
| 1944 | 0.062 |
| 1945 | 0.003 |
| 1946 | 0.008 |
| 1947 | 0.168 |
| 1948 | 0.095 |
| 1949 | 0.058 |
| 1950 | 0.014 |
| 1951 | 0.061 |
| 1952 | 0.191 |
| 1953 | 0.076 |
| 1954 | 0.284 |
| 1955 | 0.145 |
| 1956 | 0.027 |
| 1957 | 0.004 |
| 1958 | 0.016 |
| 1959 | 0.015 |
| 1960 | 0.035 |
| 1961 | 0.042 |
| 1962 | 0.021 |
| 1963 | 0.021 |
| 1964 | 0.032 |
| 1965 | 0.004 |
| 1966 | 0.042 |
| 1967 | 0.003 |
| 1968 | 0.016 |
| 1969 | 0.027 |
| 1970 | 0.014 |
| 1971 | 0.037 |
| 1972 | 0.032 |
| 1973 | 0.017 |
| 1974 | 0.015 |
| 1975 | 0.064 |
| 1976 | 0.053 |
| 1977 | 0.078 |
| 1978 | 0.033 |
| 1979 | 0.022 |
| 1980 | 0.271 |
| 1981 | 0.067 |
| 1982 | 0.007 |
| 1983 | 0.148 |
| 1984 | 0.011 |
| 1985 | 0.023 |
| 1986 | 0.079 |
| 1987 | 0.052 |
| 1988 | 0.349 |
| 1989 | 0.03 |
| 1990 | 0.063 |
| 1991 | 0.028 |
| 1992 | 0.027 |
| 1993 | 0.035 |
| 1994 | 0.063 |
| 1995 | 0.078 |
| 1996 | 0.018 |
| 1997 | 0.008 |
| 1998 | 0.124 |
| 1999 | 0.088 |
| 2000 | 0.081 |
| 2001 | 0.099 |
| 2002 | 0.111 |
| 2003 | 0.114 |
| 2004 | 0.013 |
| 2005 | 0.056 |
| 2006 | 0.217 |
| 2007 | 0.178 |
| 2008 | 0.032 |
| 2009 | 0.053 |
| 2010 | 0.15 |
| 2011 | 0.3 |
| 2012 | 0.252 |
| 2013 | 0.086 |
| 2014 | 0.027 |
| 2015 | 0.112 |
| 2016 | 0.053 |
| 2017 | 0.079 |
| 2018 | 0.107 |
| 2019 | 0.051 |
| 2020 | 0.123 |
| 2021 | 0.226 |
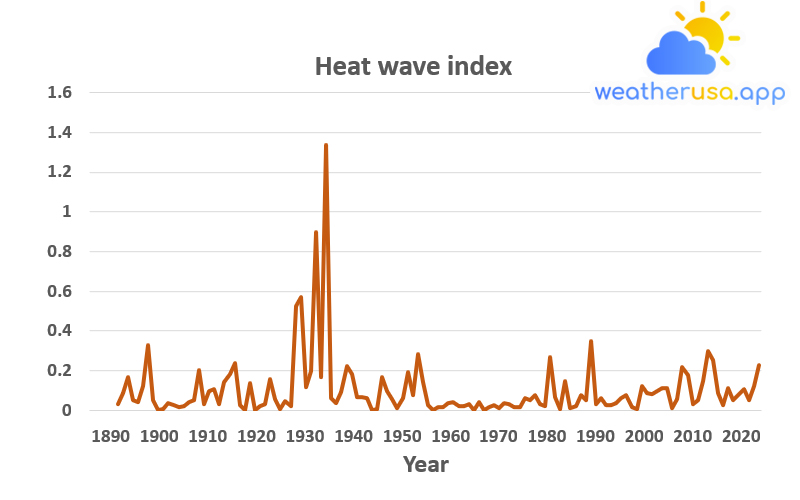
Figure 3. U.S. Annual Heat Wave Index, 1895–2021
Data source: Kunkel, 2022
Web update: July 2022
Units: heat wave index
Key Points
- Heat waves happen more often than before in major cities across the United States. Their frequency has continued to increase, going from an average of two heat waves per year during the 1960s to six per year during the years 2010 and 2020 (see Figure 1).
- The average heat wave in major US urban areas has lasted about four days in recent years. That’s about a day longer than the intermediate heat wave of the 1960s (see Figure 1).
- The average heat wave season in the 50 cities in this indicator is about 49 days longer today than in the 1960s (see Figure 1). Timing can matter, as heat waves that occur earlier in the spring or later in the fall can catch people off guard and increase exposure to health risks associated with heat waves.
- The heat waves have become more intense over time. During the 1960s, the average heat wave in the 50 cities in Figures 1 and 2 was 2.0°F above the local 85th percentile threshold. During the 2020s, the intermediate heat wave was 2.3°F above the local threshold (see Figure 1).
- Of the 50 metropolitan areas in this indicator, 46 experienced a statistically significant increase in the frequency of heat waves between the 1960s and the 2020s. The duration of heat waves increased significantly in 29 locations, during the heat wave season in 44, and intensity in 17 (see Figure 2).
- Longer-term records show that the heat waves of the 1930s remain the most severe in U.S. history (see Figure 3). The peak in Figure 3 reflects extreme and persistent heat waves in the Great Plains region during a period known as the “Dust Bowl.”
Poor land use practices and many years of intense drought have contributed to these heat waves by depleting soil moisture and reducing the moderating effects of evaporation.
Background
- A continuous period of scorching days is an extreme heat event or heat wave. Heat waves are more than uncomfortable: they can lead to illness and death, especially among the elderly, the very young, and other vulnerable populations.
Prolonged exposure to excessive heat can also have different effects, for example, damaging crops, injuring or killing livestock, and increasing the risk of forest fires. Extended periods of extreme heat can lead to power outages, as high demands for air conditioning strain the power grid.
- Sweltering days and heat waves are a natural part of daily weather variations. However, as the Earth’s climate warms, warmer-than-usual days and nights are becoming more frequent, and heat waves are expected to become more frequent and intense.
The increase in these extreme heat events can lead to more heat-related illnesses and deaths, especially if people and communities do not take action to adapt. Even small increases in extreme heat can lead to increased deaths and illnesses.
About the Indicator
- Frequency: the number of heat waves that occur each year.
- Duration: The duration of each heat wave in days.
- Duration of the season: number of days between the first heat wave of the year and the last.
- Intensity: how hot it is during the heat wave.
- A heat wave’s most severe health effects are often associated with high temperatures at night, which is usually the daily minimum. The human body must cool down at night, especially after a hot day.
If the air remains too warm at night, the body faces additional strain as the heart pumps more complicated to regulate body temperature. - Humidity adjustment is necessary because when the humidity is high, water does not evaporate as quickly, so it is more difficult for the human body to cool down by sweating. This is why extreme heat health warnings are often based on the “heat index,” which combines temperature and humidity.
- The 85th percentile of July and August temperatures are the nine hottest days of the two hottest months of the year. A temperature typically only recorded nine times during the hottest part of the year is rare enough for most people to consider it unusually warm.
- Using the 85th percentile for each city, Figures 1 and 2 define “unusual” in terms of local conditions. After all, a specific temperature like 95°F may be boiling in one town but perfectly normal in another. Also, people in relatively warm regions may be better acclimatized and adapted to hot weather.
The National Oceanic and Atmospheric Administration calculated the apparent temperature for this indicator based on temperature and humidity measurements from long-term weather stations, usually located at airports.
Figures 1 and 2 focus on the 50 most populous U.S. metropolitan areas that recorded weather data from a consistent location without many missing days during the time examined. The year 1961 was chosen as the starting point because most major cities have collected consistent data since that time.
This index defines a heat wave as a period of at least four days with an average temperature that would only be expected to persist for four days once every ten years, based on historical records. The value of the index for a given year depends on the frequency with which such violent heat waves occur and their magnitude.
About the Data
Indicator Notes
Compared to surrounding rural areas, built-up areas have higher temperatures, especially at night. Urban growth since 1961 may have contributed partly to the increase in heat waves that Figures 1 and 2 show for some cities show. T
his indicator does not attempt to adjust for the effects of development in metropolitan areas, as it focuses on the temperatures to which people are exposed and whether or not the trends reflect a combination of climate change and other factors.
However, the data in Figure 3 has been adjusted where possible to account for some of these influences and biases. These uncertainties are insufficient to change the fundamental nature of the trends.
Data Sources
Figures 1 and 2 are adapted from an analysis by Habeeb et al. They are based on temperature and humidity measurements from weather stations operated by NOAA’s National Weather Service. NOAA’s National Centers for Environmental Information compiled and provided the data.

Weather 01852 - Lowell MA

48°
overcast clouds
Feels like 46°05:32/19:50
50°F
/47°F
82%
1018 hPa
7 mi
4.61 mph


