Global Greenhouse Gas Emissions
Global Greenhouse Gas Emissions
This index describes greenhouse gas emissions worldwide.
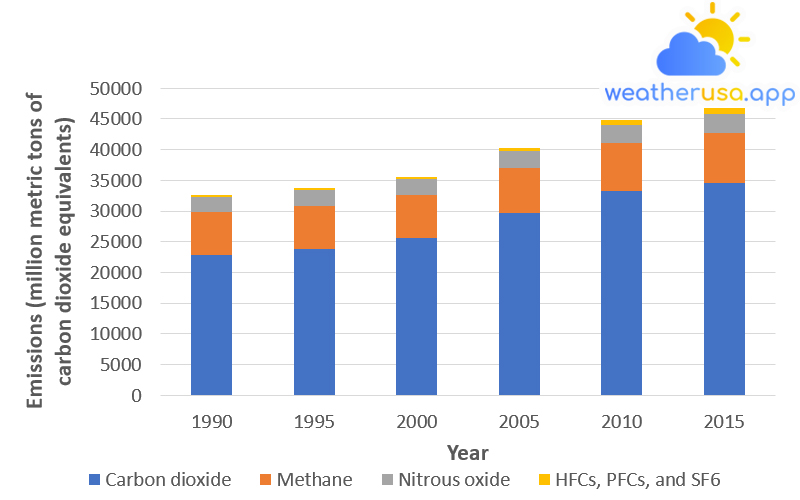
Figure 1. Global Greenhouse Gas Emissions by Gas, 1990–2015

This figure shows the worldwide emissions of carbon dioxide, methane, nitrogen oxides, and some fluorinated gases from 1990 to 2015. For consistency, emissions are expressed in million tons of carbon dioxide equivalent. These totals include emissions and uptakes due to land use and forestry changes.
* HFC is hydrofluorocarbon, PFC is perfluorocarbon, and SF6 is sulfur hexafluoride.
| Year | Carbon dioxide | Methane | Nitrous oxide |
HFCs, PFCs, and SF6
|
| 1990 | 22849.92 | 7072.53 | 2421.26 | 302.21 |
| 1995 | 23890.22 | 6946.31 | 2537.56 | 329.36 |
| 2000 | 25637.87 | 6990.5 | 2535.63 | 443.72 |
| 2005 | 29663.75 | 7373.14 | 2721.22 | 541.91 |
| 2010 | 33328.38 | 7816.38 | 2851.54 | 762.28 |
| 2015 | 34521.91 | 8240.68 | 2997.24 | 1000.64 |
Figure 1. Global Greenhouse Gas Emissions by Gas, 1990-2015
Data source: WRI, 2021; FAO, 2020
Web update: April 2021
Units: million metric tons CO2e
Figure 2. Global Greenhouse Gas Emissions by Sector, 1990–2015
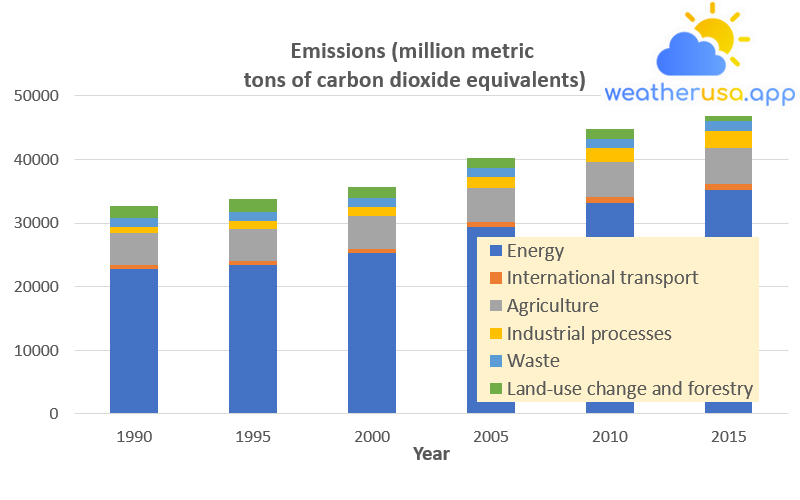
Note that the fields shown here differ from the economic sectors used in US emissions accounting. Emissions from international transport are separate from the energy sector because they are not included in individual country emissions inventories. The energy sector consists of all other transportation activities.
| Year | Energy | International transport | Agriculture | Industrial processes | Waste | Land-use change and forestry |
| 1990 | 22706.09 | 657.86 | 4997.83 | 1010.44 | 1364.4 | 1909.29 |
| 1995 | 23356.41 | 692.11 | 5038.18 | 1225.1 | 1476.51 | 1915.15 |
| 2000 | 25294.42 | 692.99 | 5094.12 | 1388.47 | 1466.76 | 1670.96 |
| 2005 | 29384.07 | 817.01 | 5307.63 | 1737.33 | 1422.66 | 1631.34 |
| 2010 | 33211.11 | 853.81 | 5515.23 | 2223.08 | 1465.13 | 1490.21 |
| 2015 | 35124.15 | 936.09 | 5691.56 | 2678.62 | 1543.59 | 786.46 |
Figure 2. Global Greenhouse Gas Emissions by Sector, 1990-2015
Data source: WRI, 2021; FAO, 2020
Web update: April 2021
Units: million metric tons CO2e
Figure 3. Global Carbon Dioxide Emissions by Region, 1990–2018
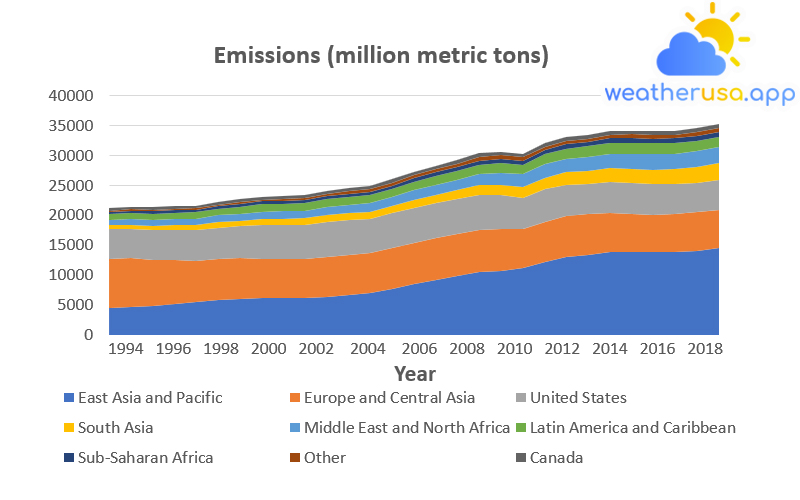
This figure shows carbon dioxide emissions from 1990 to 2018 for different regions of the world. These totals do not include emissions or absorptions related to land use or forestry change. Including land use and forestry, changes would increase emissions clearly from some regions while reducing emissions from others.
| Region | 1994 | 1998 | 2002 | 2006 | 2010 | 2014 | 2018 |
| East Asia and Pacific | 5397.56 | 6061.23 | 6943.22 | 9816.27 | 12070.61 | 13761.58 | 14420.47 |
| Europe and Central Asia | 6911.52 | 6658.27 | 6733.73 | 7096.78 | 6790.35 | 6357.68 | 6428.11 |
| United States | 5162.62 | 5687.72 | 5709.68 | 5785.89 | 5509.52 | 5215.48 | 5102.92 |
| South Asia | 814.4 | 996.21 | 1169.64 | 1442.73 | 1927.54 | 2439.41 | 2828.14 |
| Middle East and North Africa | 1121.68 | 1241.05 | 1457 | 1827.78 | 2204.49 | 2504.76 | 2608.22 |
| Latin America and Caribbean | 1055.61 | 1280.53 | 1319.14 | 1488.61 | 1662.21 | 1839.25 | 1749.36 |
| Sub-Saharan Africa | 436.93 | 495.57 | 554.63 | 641.07 | 723.73 | 817.83 | 845.63 |
| Other | 241.75 | 320.65 | 461.15 | 555.05 | 611.62 | 581.46 | 670.08 |
| Canada | 449.71 | 499.24 | 536.14 | 556.53 | 552.49 | 581.3 | 595.81 |
Figure 3. Global Carbon Dioxide Emissions by Region, 1990-2018
Data source: WRI, 2021
Web update: April 2021
Units: million metric tons
Key Points
- In 2015, it was estimated that worldwide emissions from human activities amounted to nearly 47 billion tons of greenhouse gases, expressed in carbon dioxide equivalents. This figure represents a 43 percent increase over 1990 (see Figures 1 and 2). These numbers represent net emissions, including impacts of land use and forestry.
- Between 1990 and 2015, global emissions of all major greenhouse gases increased (see Figure 1). Net carbon dioxide emissions increased by 51 percent, which is especially important because carbon dioxide accounts for about three-quarters of all global emissions. Methane emissions increased by at least—17 percent—while nitrogen oxide emissions increased by 24 percent. Fluorine emissions more than tripled.
- Energy production and use is the largest source of greenhouse gas emissions worldwide, followed by agriculture (see Figure 2). Although land use change and forestry represent net emissions in the United States, sequestering carbon dioxide and offsetting emissions from other sources, these activities represent a global source of net emissions. Demand is mainly due to deforestation.
- Carbon dioxide emissions are growing faster in some parts of the world than in others (see Figure 3). The majority of emissions come from three regions: East Asia and the Pacific, Europe and Central Asia, and the United States, which accounted for 74% of total global emissions in 2018.
Background
Increased greenhouse gas emissions due to human activities worldwide have resulted in significant increases in atmospheric concentrations of other long-lived and other greenhouse gases. Every country in the world emits greenhouse gases into the atmosphere, meaning the root causes of climate change are truly global in scope.
Some countries produce far more greenhouse gases than others, and many factors—such as economic activity, population, income levels, land use, and climate conditions—can affect a country’s emissions. Tracking greenhouse gas emissions worldwide provides a global context for understanding the role of the United States and other countries in climate change.
About Indicators
- Like the US Greenhouse Gas Emissions indicator, this indicator focuses on emissions of the gases covered by the United Nations Framework Convention on Climate Change: carbon dioxide, methane, nitrous oxide, and fluorine gas. These are all vital greenhouse gases affected by human activities, and the Convention requires participating countries to develop and submit periodic inventories of these emissions.
- The data and analysis for this indicator come from the World Resources Institute’s Climate Analysis Indicator Tool, which aggregates data from internationally recognized and peer-reviewed greenhouse gas inventories produced by the EPA and other government agencies throughout the developed world. Global estimates for carbon dioxide are published yearly, but estimates for other gases, such as methane and nitrous oxide, are only available every fifth year. CAIT includes emissions and uptakes related to land use and forestry activities derived from global estimates compiled by the Food and Agriculture Organization of the United Nations.
- Each greenhouse gas has a different lifespan and can trap heat in our atmosphere. The emissions are converted to an equivalent amount of carbon dioxide to allow other gases to be compared and added. This step uses each gas’s 100-year global warming potential, measuring how much a given gas contributes to global warming over 100 years after it is released. Carbon dioxide is assigned a global warming potential of 1. This analysis uses the global warming potential from the Fourth Assessment Report of the Intergovernmental Panel on Climate Change. In that report, methane has a global warming potential of 25, meaning that one ton of methane emissions causes 25 times more warming than one ton of carbon dioxide emissions over 100 years. That ton of methane is equivalent to 25 tons of carbon dioxide equivalent. See a table comparing global warming potential from the IPCC Fifth Assessment Report.
About the Data
Indicator Notes
Like the US GHG Emissions index, it does not include emissions that affect climate but are not covered by the United Nations Framework Convention on Climate Change Queen. For example, this indicator does not include ozone-depleting substances such as chlorofluorocarbons and hydrochlorofluorocarbons, which have high global warming potential, because these gases have been or are being phased out under an international agreement convention known as the Montreal Protocol. The index also excludes black carbon and aerosols, which most emissions inventories do not include. There are also many types of naturally occurring greenhouse gas emissions that this index does not have.
The global emissions inventory for gases other than carbon dioxide is limited to 5 years. The United Nations Framework Convention on Climate Change database has more comprehensive data; however, these data are mainly for a group of primarily developed countries that account for only about half of global greenhouse gas emissions. Therefore, to provide a more representative measure of global greenhouse gas emissions, the index uses WRI’s broader database.

Weather 01852 - Lowell MA

56°
clear sky
Feels like 55°05:30/19:53
60°F
/52°F
73%
1003 hPa
7 mi
6.91 mph


