Glaciers
Glaciers
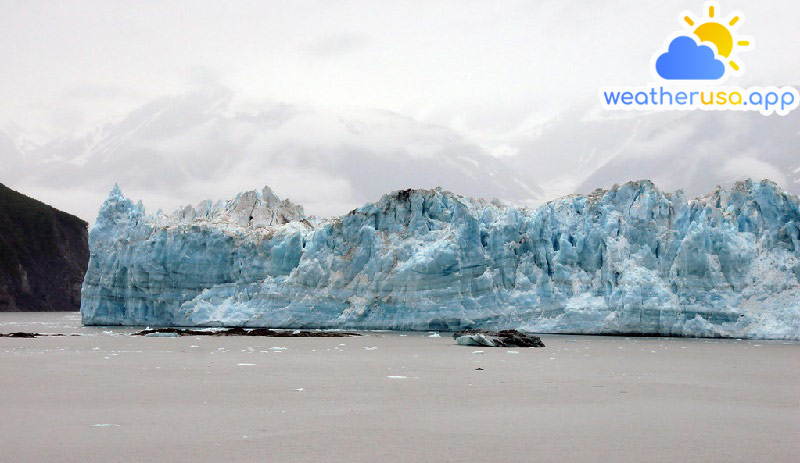
A glacier is a persistent body of dense ice constantly moving under its weight. A glacier forms when snow accumulation exceeds its ablation for many years, often centuries.
It acquires distinctive characteristics, such as crevasses and seracs, as it slowly flows and deforms under the stresses induced by its weight. As it moves, it abrades the rock and debris from its substrate to create reliefs such as cirques, moraines, or fjords.
Although a glacier can flow through a body of water, it only forms on land and is distinct from sea ice and the much thinner lake ice that forms on the surface of bodies of water.

Climate Change Indicators: Glaciers
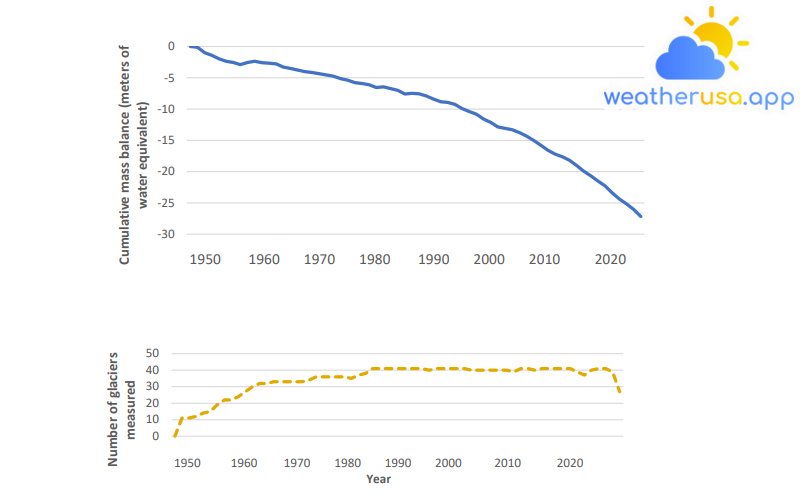
For consistency, measurements are in meters of water equivalent, representing changes in a glacier’s average thickness. The small graph below shows how many glaciers have been measured each year. Some glacial measurements have not yet been finalized for a few years, hence the decrease in the number of sites.
| Year | Mean cumulative mass balance | Number of observations |
| 1956 | 0 | |
| 1957 | -0.12 | 11 |
| 1958 | -0.976 | 11 |
| 1959 | -1.414 | 12 |
| 1960 | -1.968 | 14 |
| 1961 | -2.362 | 15 |
| 1962 | -2.569 | 19 |
| 1963 | -2.885 | 22 |
| 1964 | -2.545 | 22 |
| 1965 | -2.373 | 24 |
| 1966 | -2.578 | 27 |
| 1967 | -2.662 | 30 |
| 1968 | -2.776 | 32 |
| 1969 | -3.277 | 32 |
| 1970 | -3.519 | 33 |
| 1971 | -3.758 | 33 |
| 1972 | -4.016 | 33 |
| 1973 | -4.147 | 33 |
| 1974 | -4.339 | 33 |
| 1975 | -4.534 | 34 |
| 1976 | -4.752 | 36 |
| 1977 | -5.14 | 36 |
| 1978 | -5.372 | 36 |
| 1979 | -5.785 | 36 |
| 1980 | -5.919 | 36 |
| 1981 | -6.11 | 35 |
| 1982 | -6.568 | 37 |
| 1983 | -6.438 | 38 |
| 1984 | -6.726 | 41 |
| 1985 | -7.009 | 41 |
| 1986 | -7.586 | 41 |
| 1987 | -7.475 | 41 |
| 1988 | -7.559 | 41 |
| 1989 | -7.892 | 41 |
| 1990 | -8.399 | 41 |
| 1991 | -8.832 | 41 |
| 1992 | -8.935 | 40 |
| 1993 | -9.242 | 41 |
| 1994 | -9.917 | 41 |
| 1995 | -10.384 | 41 |
| 1996 | -10.819 | 41 |
| 1997 | -11.611 | 41 |
| 1998 | -12.134 | 40 |
| 1999 | -12.861 | 40 |
| 2000 | -13.088 | 40 |
| 2001 | -13.317 | 40 |
| 2002 | -13.755 | 40 |
| 2003 | -14.326 | 40 |
| 2004 | -15.018 | 39 |
| 2005 | -15.758 | 41 |
| 2006 | -16.591 | 41 |
| 2007 | -17.202 | 40 |
| 2008 | -17.619 | 41 |
| 2009 | -18.169 | 41 |
| 2010 | -19.011 | 41 |
| 2011 | -19.92 | 41 |
| 2012 | -20.657 | 41 |
| 2013 | -21.502 | 39 |
| 2014 | -22.285 | 37 |
| 2015 | -23.402 | 40 |
| 2016 | -24.383 | 41 |
| 2017 | -25.152 | 41 |
| 2018 | -26.043 | 39 |
| 2019 | -27.174 | 27 |
Figure 1. Average Cumulative Mass Balance of “Reference” Glaciers Worldwide, 1956-2019
Data source: WGMS, 2020
Web update: April 2021
Units: m of water equivalent; count
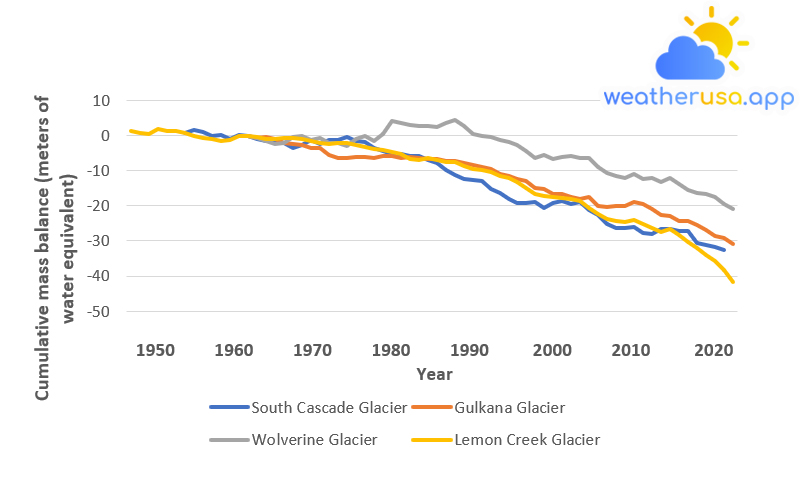
This figure shows the cumulative mass balance of four U.S. reference glaciers since measurements began in the 1950s or 1960s. For each glacier, the mass ratio is set to zero for the reference year 1965.
Negative values indicate a net loss of ice and snow compared to the base year. For consistency, measurements are in meters of water equivalent, representing changes in a glacier’s average thickness.
| Year | South Cascade Glacier | Gulkana Glacier | Wolverine Glacier | Lemon Creek Glacier |
| 1952 | 1.15 | |||
| 1953 | 0.67 | |||
| 1954 | 0.57 | |||
| 1955 | 1.77 | |||
| 1956 | 1.21 | |||
| 1957 | 1.3 | |||
| 1958 | 0.76 | 0.8 | ||
| 1959 | 1.49 | -0.02 | ||
| 1960 | 1.02 | -0.76 | ||
| 1961 | -0.05 | -0.92 | ||
| 1962 | 0.18 | -1.53 | ||
| 1963 | -1.09 | -1.28 | ||
| 1964 | 0.14 | -0.16 | ||
| 1965 | 0 | 0 | 0 | 0 |
| 1966 | -1 | -0.74 | -0.64 | -0.41 |
| 1967 | -1.6 | -0.56 | -1.53 | -0.93 |
| 1968 | -1.56 | -1.05 | -2.43 | -1.07 |
| 1969 | -2.26 | -2.26 | -2.24 | -0.78 |
| 1970 | -3.43 | -2.31 | -0.51 | -0.79 |
| 1971 | -2.8 | -2.79 | -0.2 | -1.11 |
| 1972 | -1.34 | -3.6 | -1.27 | -1.68 |
| 1973 | -2.35 | -3.6 | -0.82 | -2.12 |
| 1974 | -1.3 | -5.51 | -2.07 | -2.41 |
| 1975 | -1.32 | -6.32 | -2.19 | -2.04 |
| 1976 | -0.34 | -6.38 | -2.98 | -2.21 |
| 1977 | -1.61 | -6.05 | -1.01 | -2.61 |
| 1978 | -1.96 | -6.13 | -0.19 | -3.33 |
| 1979 | -3.49 | -6.41 | -1.56 | -3.87 |
| 1980 | -4.48 | -5.79 | 0.52 | -4.06 |
| 1981 | -5.29 | -5.9 | 4.08 | -4.79 |
| 1982 | -5.18 | -6.41 | 3.66 | -5.14 |
| 1983 | -5.92 | -6.03 | 3.1 | -6.68 |
| 1984 | -5.77 | -6.53 | 2.64 | -6.85 |
| 1985 | -6.94 | -6.79 | 2.81 | -6.44 |
| 1986 | -7.81 | -6.76 | 2.3 | -6.87 |
| 1987 | -9.92 | -7.39 | 3.61 | -7.63 |
| 1988 | -11.11 | -7.33 | 4.54 | -7.44 |
| 1989 | -12.31 | -7.75 | 2.82 | -8.6 |
| 1990 | -12.67 | -8.42 | 0.33 | -9.63 |
| 1991 | -13.04 | -8.84 | -0.22 | -9.93 |
| 1992 | -15.24 | -9.55 | -0.55 | -10.51 |
| 1993 | -16.28 | -11.06 | -1.39 | -11.41 |
| 1994 | -18.05 | -11.45 | -1.92 | -12.09 |
| 1995 | -19.07 | -12.47 | -2.57 | -13.32 |
| 1996 | -19.18 | -12.93 | -4.32 | -14.82 |
| 1997 | -18.86 | -14.85 | -6.37 | -16.55 |
| 1998 | -20.75 | -15.3 | -5.65 | -17.27 |
| 1999 | -19.2 | -16.71 | -6.61 | -17.51 |
| 2000 | -18.67 | -16.66 | -6.09 | -17.78 |
| 2001 | -19.43 | -17.61 | -5.74 | -18.11 |
| 2002 | -18.84 | -18.14 | -6.27 | -18.72 |
| 2003 | -21.08 | -17.56 | -6.45 | -20.64 |
| 2004 | -22.67 | -19.97 | -8.88 | -22.28 |
| 2005 | -25.06 | -20.46 | -10.62 | -23.76 |
| 2006 | -26.3 | -19.99 | -11.48 | -24.3 |
| 2007 | -26.31 | -20.16 | -12.1 | -24.7 |
| 2008 | -26.15 | -18.8 | -10.87 | -24.08 |
| 2009 | -27.79 | -19.37 | -12.51 | -25.22 |
| 2010 | -28.02 | -20.99 | -12.19 | -26.37 |
| 2011 | -26.62 | -22.62 | -13.34 | -27.36 |
| 2012 | -26.52 | -23 | -12.02 | -26.71 |
| 2013 | -27.18 | -24.2 | -13.8 | -28.44 |
| 2014 | -27.3 | -24.26 | -15.57 | -30.23 |
| 2015 | -30.5 | -25.59 | -16.42 | -31.91 |
| 2016 | -31.26 | -26.88 | -16.56 | -33.96 |
| 2017 | -31.87 | -28.68 | -17.64 | -35.72 |
| 2018 | -32.61 | -29.06 | -19.5 | -38.32 |
| 2019 | -31.01 | -21 | -41.72 |
Figure 2. Cumulative Mass Balance of Four U.S. Glaciers, 1958-2019
Data source: USGS, 2020
Web update: April 2021
Units: m of water equivalent
Key points
- On average, glaciers worldwide have been losing mass since at least the 1970s (see Figure 1), which in turn has contributed to observed changes in sea level.
A longer measurement record of a smaller number of glaciers suggests they have shrunk since the 1950s. The rate at which glaciers are losing mass appears to have accelerated over the past decade or so. - The four US reference glaciers have shown an overall decline in mass balance since the 1950s and 1960s and an accelerating rate of decline in recent years (see Figure 2).
Year-to-year trends vary, with some glaciers gaining mass in some years, but measurements indicate a loss of glacier mass over time. - Trends for the four U.S. reference glaciers are consistent with observed glacier retreats in the western United States, Alaska, and other parts of the world.
Observations of glaciers losing mass are also compatible with warming trends in the U.S. and global temperatures during this time.
Background
- A glacier is a large mass of snow and ice that has accumulated over many years and is present all year round. In the United States, glaciers are found in the Rockies, Sierra Nevada, Cascades, and throughout Alaska.
A glacier naturally flows like a river but much more slowly. At higher elevations, glaciers accumulate snow, which eventually compresses into ice. At lower elevations, the “river” of ice naturally loses mass through melting, and the ice breaks off and flies away if the glacier ends in a lake or the ocean.
When melting and calving are exactly balanced by the new accumulation of snow, a glacier is in equilibrium, and its mass will neither increase nor decrease. - In many regions, glaciers provide communities and ecosystems with a reliable flow and drinking water source, particularly during periods of prolonged drought and in late summer when the seasonal snowpack has melted.
Freshwater runoff from glaciers also influences ocean ecosystems. Glaciers are important indicators of climate change because physical changes in glaciers – growing or shrinking, advancing or retreating – provide visible evidence of changes in temperature and precipitation.
If glaciers lose more ice than they can accumulate through new snowfall, they add more water to the oceans, causing sea levels to rise. - The same changes are happening on a much larger scale in the giant ice sheets covering Greenland and Antarctica, potentially leading to even more significant implications for sea levels.
Smaller glaciers tend to react faster to climate change than massive ice caps. The world’s small glaciers add about the same amount of water to the oceans each year as the Greenland and Antarctic ice sheets combined.
Over the past two decades, they have globally added more water to the oceans than the ice sheets, potentially leading to even more tremendous implications for sea levels.
About the indicator
- This indicator is based on long-term monitoring data collected from selected glaciers worldwide. Scientists collect detailed measurements to determine the mass balance of glaciers: the net gain or loss of snow and ice over the year.
A negative mass balance indicates that a glacier has lost ice or snow. If the cumulative mass balance becomes more negative over time, glaciers lose mass faster than they can accumulate new snow. - Figure 1 shows mass balance trends for 41 reference glaciers worldwide that have been measured consistently since the 1970s, including several that have been measured since the 1950s.
Data from these reference glaciers were averaged together to represent changes over time. Figure 2 shows the trends for four reference glaciers in the United States.
South Cascade Glacier in Washington State, Wolverine Glacier near the south coast of Alaska, Gulkana Glacier in Interior Alaska, and Lemon Creek Glacier in Southeast Alaska make all part of the US Geological Survey’s long-standing reference glacier program.
These four glaciers were chosen because they have been studied extensively for many years and are thought to represent nearby glaciers. - This indicator describes the variation in the mass balance of glaciers, which is measured as the average variation in thickness at the surface of a glacier. The change in ice or snow was converted to the equivalent amount of liquid water.
About the Data
Notes on indicators
- The relationship between climate change and glacier mass balance is complex. Differences observed at specific baseline, or reference glaciers could reflect global and local variations in temperature and precipitation.
Individual glaciers also vary in structure, flow, and response to climate. Slightly different measurement and analysis methods have been used on other glaciers, but the general trends seem similar. - Long-term measurements are only available for a relatively small percentage of the world’s glaciers. This indicator does not include the Greenland and Antarctic ice sheets, although two decades of satellite data suggest that these sheets are also experiencing a net loss of ice.
A further collection of satellite data will allow scientists to assess long-term trends in the future.
Data Sources
The World Glacier Monitoring Service compiled the data in Figure 1 based on measurements collected by various organizations worldwide. The US Geological Survey Benchmark Glacier Program provided the data for the four glaciers in Figure 2.
Weather 01852 - Lowell MA

69°
overcast clouds
Feels like 68°06:17/19:09
70°F
/66°F
74%
1009 hPa
7 mi
8.05 mph