Coastal Flooding
Coastal flooding
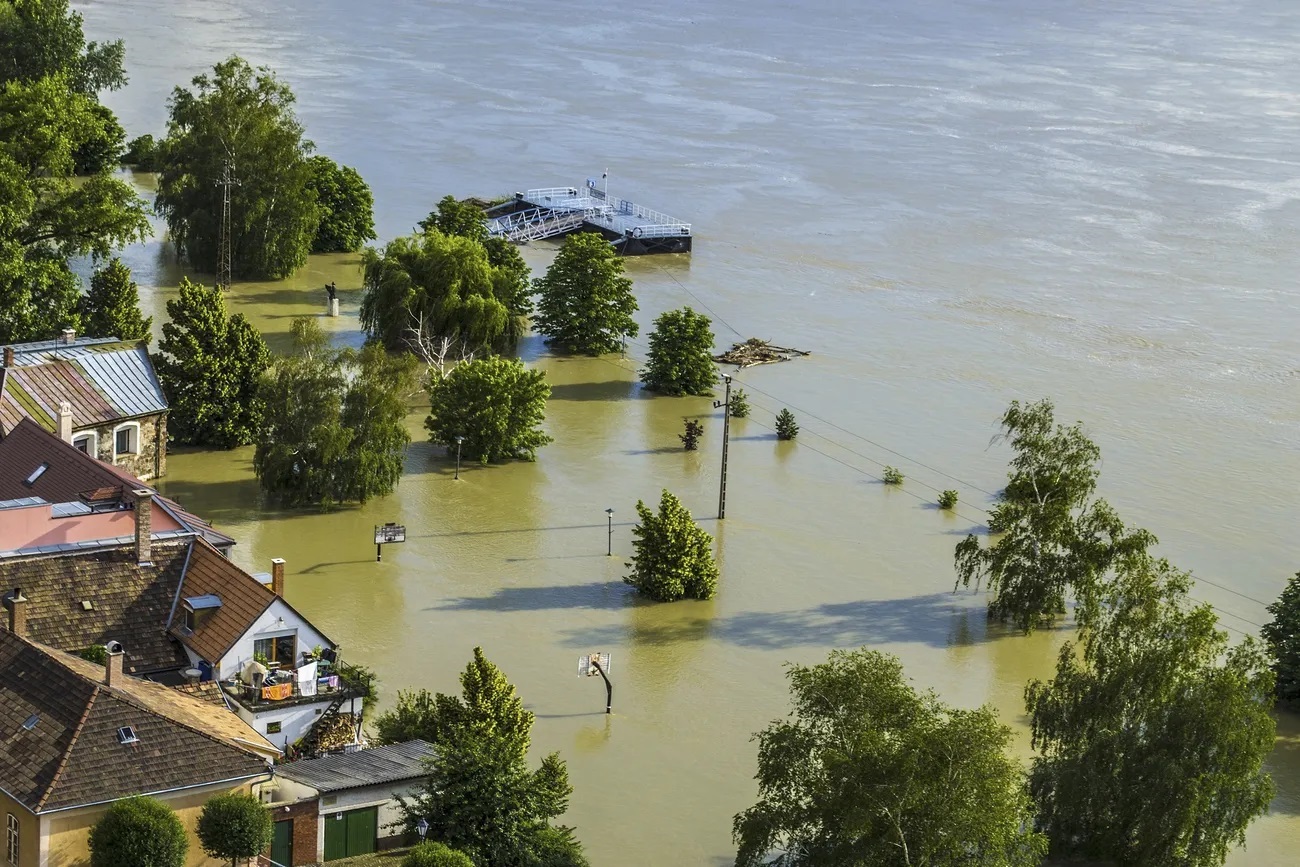
Coastal floods usually occur when dry, low-lying lands are flooded with seawater. A coastal floodplain results from the uplift of inland penetrating floodwater controlled by the topography of the flooded coastal land.
Flood damage modeling was limited to local, regional, or national scales. However, with climate change and the increase in population rates, flood events have intensified, creating global interest in finding different modalities with both spatial and temporal dynamics.

Seawater can flood the land in several ways: direct flooding, breaking a barrier, breaking a barrier.
Coastal flooding is largely a natural phenomenon, but the human impact on the coastal environment can exacerbate coastal flooding. Withdrawal from groundwater reservoirs in the coastal zone can cause land subsidence, increasing the risk of flooding.
Conservation structures designed along the coast, such as seawalls, alter the natural processes of the beach, often leading to erosion of adjacent parts of the coast, and increasing the risk of flooding. In addition, sea level rise and extreme weather conditions caused by climate change will increase the intensity and amount of coastal flooding, affecting hundreds of millions of people.
Climate Change Indicators: Coastal Flooding
This indicator shows how the frequency of coastal flooding has changed over time.
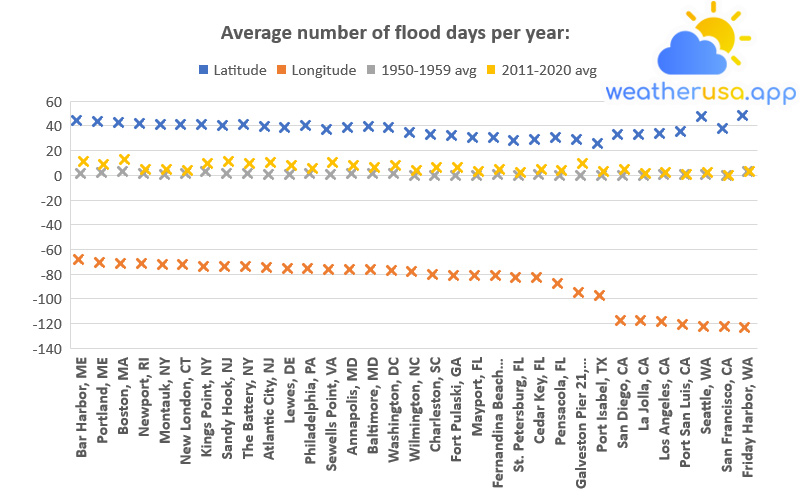
This map shows the average number of days per year coastal waters exceeded the local flood threshold at 33 locations along the US coast. Each small bar graph compares the first decade of extended measurements with the last decade.
| Site name | Latitude | Longitude | 1950-1959 avg | 2011-2020 avg |
| Bar Harbor, ME | 44.3917 | -68.205 | 1.5 | 10.8 |
| Portland, ME | 43.6567 | -70.2467 | 2.555556 | 8.5 |
| Boston, MA | 42.3548 | -71.0534 | 2.9 | 13.1 |
| Newport, RI | 41.505 | -71.3267 | 1.25 | 4.8 |
| Montauk, NY | 41.0483 | -71.96 | 0.888889 | 4.5 |
| New London, CT | 41.36139 | -72.09 | 1.3 | 4.1 |
| Kings Point, NY | 40.8103 | -73.7649 | 3.1 | 9.2 |
| Sandy Hook, NJ | 40.4669 | -74.0094 | 1.4 | 10.8 |
| The Battery, NY | 40.7006 | -74.0142 | 1.555556 | 9.8 |
| Atlantic City, NJ | 39.355 | -74.4183 | 0.4 | 10.2 |
| Lewes, DE | 38.78169 | -75.12 | 0.857143 | 8.2 |
| Philadelphia, PA | 39.93333 | -75.1417 | 1.222222 | 5.4 |
| Sewells Point, VA | 36.94667 | -76.33 | 0.9 | 10.5 |
| Annapolis, MD | 38.98328 | -76.4816 | 1.111111 | 7.8 |
| Baltimore, MD | 39.26667 | -76.5783 | 1.2 | 6.6 |
| Washington, DC | 38.87333 | -77.0217 | 1.2 | 7.6 |
| Wilmington, NC | 34.2267 | -77.9533 | 0.1 | 3.7 |
| Charleston, SC | 32.7817 | -79.925 | 0.111111 | 6.2 |
| Fort Pulaski, GA | 32.0333 | -80.9017 | 0 | 6.6 |
| Mayport, FL | 30.3967 | -81.43 | 0 | 2.7 |
| Fernandina Beach, FL | 30.6717 | -81.465 | 0.75 | 4.6 |
| St. Petersburg, FL | 27.7606 | -82.6269 | 0.111111 | 2.1 |
| Cedar Key, FL | 29.135 | -83.0317 | 0.7 | 4.9 |
| Pensacola, FL | 30.4044 | -87.2112 | 0.222222 | 3.7 |
| Galveston Pier 21, TX | 29.31 | -94.7933 | 0.1 | 9.6 |
| Port Isabel, TX | 26.06 | -97.215 | 0 | 3.1 |
| San Diego, CA | 32.71419 | -117.174 | 0.1 | 4.9 |
| La Jolla, CA | 32.8667 | -117.258 | 0 | 1.8 |
| Los Angeles, CA | 33.72 | -118.272 | 0.4 | 1.9 |
| Port San Luis, CA | 35.1767 | -120.76 | 0.75 | 0.7 |
| Seattle, WA | 47.60264 | -122.339 | 0.9 | 2.5 |
| San Francisco, CA | 37.80669 | -122.465 | 0 | 0.1 |
| Friday Harbor, WA | 48.54667 | -123.01 | 2.666667 | 3 |
Figure 1. Frequency of Flooding Along U.S. Coasts, 2011–2020 Versus 1950–1959
Data source: NOAA, 2021
Web update: April 2021
Units: degrees; degrees; the average number of flood days per year; the average number of flood days per year
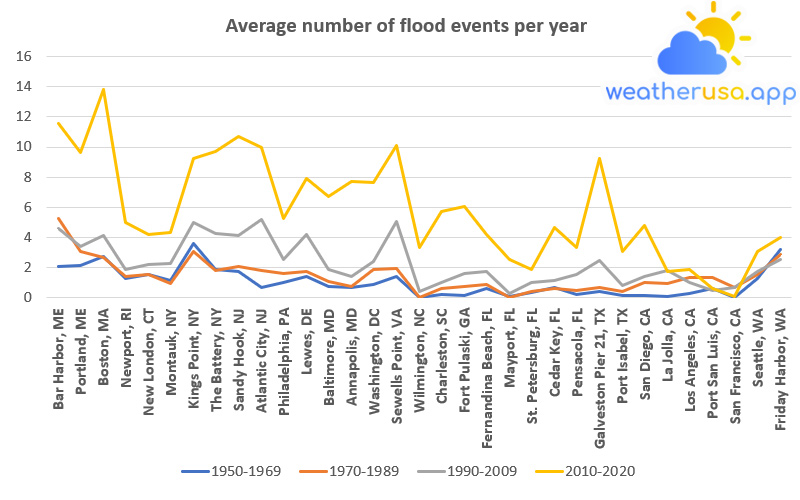
This chart shows the average number of days per year that coastal waters exceeded the local flood threshold at 33 locations along the U.S. coast. Data were averaged over multiple years for comparison.
| 1950-1969 | 1970-1989 | 1990-2009 | 2010-2020 | |
| Bar Harbor, ME | 2.052632 | 5.277778 | 4.625 | 11.54545 |
| Portland, ME | 2.166667 | 3.105263 | 3.4 | 9.636364 |
| Boston, MA | 2.75 | 2.7 | 4.15 | 13.81818 |
| Newport, RI | 1.277778 | 1.444444 | 1.9 | 5 |
| New London, CT | 1.526316 | 1.529412 | 2.25 | 4.181818 |
| Montauk, NY | 1.166667 | 0.9375 | 2.277778 | 4.363636 |
| Kings Point, NY | 3.578947 | 3.111111 | 5 | 9.272727 |
| The Battery, NY | 1.894737 | 1.842105 | 4.294118 | 9.727273 |
| Sandy Hook, NJ | 1.75 | 2.052632 | 4.15 | 10.72727 |
| Atlantic City, NJ | 0.684211 | 1.8125 | 5.210526 | 10 |
| Philadelphia, PA | 1 | 1.6 | 2.55 | 5.272727 |
| Lewes, DE | 1.4375 | 1.722222 | 4.2 | 7.909091 |
| Baltimore, MD | 0.75 | 1.1 | 1.9 | 6.727273 |
| Annapolis, MD | 0.666667 | 0.789474 | 1.421053 | 7.727273 |
| Washington, DC | 0.9 | 1.9 | 2.388889 | 7.636364 |
| Sewells Point, VA | 1.45 | 1.95 | 5.05 | 10.09091 |
| Wilmington, NC | 0.052632 | 0.05 | 0.45 | 3.363636 |
| Charleston, SC | 0.210526 | 0.631579 | 1.05 | 5.727273 |
| Fort Pulaski, GA | 0.15 | 0.75 | 1.65 | 6.090909 |
| Fernandina Beach, FL | 0.611111 | 0.894737 | 1.722222 | 4.181818 |
| Mayport, FL | 0.1 | 0.05 | 0.3 | 2.545455 |
| St. Petersburg, FL | 0.333333 | 0.4 | 1 | 1.909091 |
| Cedar Key, FL | 0.7 | 0.65 | 1.166667 | 4.636364 |
| Pensacola, FL | 0.222222 | 0.5 | 1.526316 | 3.363636 |
| Galveston Pier 21, TX | 0.4 | 0.705882 | 2.5 | 9.272727 |
| Port Isabel, TX | 0.15 | 0.4 | 0.85 | 3.090909 |
| San Diego, CA | 0.157895 | 1.052632 | 1.45 | 4.818182 |
| La Jolla, CA | 0.111111 | 0.941176 | 1.85 | 1.727273 |
| Los Angeles, CA | 0.3 | 1.368421 | 1.05 | 1.909091 |
| Port San Luis, CA | 0.625 | 1.368421 | 0.5 | 0.636364 |
| San Francisco, CA | 0.05 | 0.666667 | 0.7 | 0.090909 |
| Seattle, WA | 1.3 | 1.55 | 1.75 | 3.090909 |
| Friday Harbor, WA | 3.235294 | 2.9 | 2.55 | 4 |
Figure 2. Average Number of Coastal Flood Events per Year, 1950–2020
Data source: NOAA, 2021
Web update: April 2021
Units: average number of flood events per year
Key points
- Flooding is becoming more common along the US coast. At every location measured, there has been an increase in coastal flooding since the 1950s (see Figure 1).
The growth rate is accelerating in most sites along the East and Gulf Coasts (see Figure 2). - The East Coast experiences the most frequent coastal flooding and has generally seen the most significant increase in flood days.
Since 2011, Boston, Massachusetts, has exceeded the flood threshold most frequently—an average of 13 days per year—followed by Bar Harbor, Maine, and Sandy Hook, New Jersey.
In more than half of the locations shown, floods are now at least five times more frequent than in the 1950s. - Flooding increased less dramatically in places where the relative sea levels did not rise as quickly as elsewhere in the United States.
Background
- Changing sea levels affect human activities in coastal areas. Rising sea levels inundate low-lying wetlands and dry land, erode coastlines, contribute to coastal flooding, and increase saltwater flow into estuaries and nearby groundwater.
Higher sea levels also make coastal infrastructure more vulnerable to storm damage.
- “Relative Sea Level Change” refers to the height of the ocean relative to the land at a particular location. As relative sea levels rise due to climate change, one of the most obvious consequences is increased coastal flooding.
Flooding usually occurs during high seasonal tides and storms pushing water toward the shore. In recent years, however, coastal cities have increasingly experienced flooding on days with less extreme waves or light winds, even on sunny days.
Flooding occurs more frequently because rising sea levels reduce the difference between mean sea level and land elevation. This type of tidal flooding is expected to increase in depth, frequency, and extent in the United States during this century.
- Many coastal cities have defined “nuisance” flood thresholds. When the water rises above this level, some streets typically experience minor flooding impacts, many storm drains become ineffective, and coastal flood advisories may be issued.
Repeated coastal flooding can cause frequent road closures, reduced stormwater drainage capacity, and deterioration of infrastructure not designed to withstand periodic flooding or exposure to saltwater.
These impacts are particularly problematic because more than 40 percent of Americans live near the coast, and more than $1 trillion in property and structures are at risk.
Coastal flooding can also affect human health—for example, by increasing the chance that drinking water and wastewater infrastructure will fail and put people at risk of exposure to pathogens and harmful chemicals.
About the Indicator
This indicator focuses on 33 tide gauges where data from 1950 to the present are available. The hand tracks the number of days per year that each tide gauge measured water higher than the local flood threshold set by the National Oceanic and Atmospheric Administration.
Figure 1 shows the 33 stations on a map and compares data from the first and last decade, while Figure 2 provides a more detailed comparison using all years of data since 1950.
About the Data
Notes on indicators
- Flood thresholds for this indicator are defined based on a statistical approach that considers typical local tidal fluctuations. This method is helpful because it allows scientists to calculate the flood threshold for any location along the coast if enough data has been collected.
However, these flood thresholds do not necessarily correspond to the observed disruption or damage level. Each city is unique in terms of land cover, topography, roads and other infrastructure, and the presence of flood defenses such as seawalls.
As a result of these differences, a flood that reaches the threshold in one city may cause minor inconvenience to only a few people. In contrast, water from the hall in another town may inundate large parts of a low-lying central area.
- This indicator is limited to tide gauges with several decades of data. These tide gauges tend to be clustered along the east coast, especially in the mid-Atlantic region. Other parts of the US coast have fewer tide gauges with long-term data.

Weather 01852 - Lowell MA

58°
clear sky
Feels like 57°05:31/19:51
63°F
/53°F
68%
1005 hPa
7 mi
0 mph


