Climate Forcing
Climate Forcing
Climate forcing is any factor that influences the Earth’s climate system and drives changes in the global climate. These factors can be natural or human-induced and can positively and negatively impact the Earth’s atmosphere.
Some examples of natural climate forcings include changes in solar radiation, volcanic eruptions, and variations in the Earth’s orbit around the sun. On the other hand, human-induced climate forcings have the burning of fossil fuels, deforestation, and releasing greenhouse gases into the atmosphere.
Climate forcing can affect the Earth’s climate by altering the balance of energy in the Earth’s atmosphere and oceans. For example, greenhouse gases, such as carbon dioxide and methane, trap heat in the Earth’s atmosphere, causing global temperatures to rise. This is known as the greenhouse effect, one of the main drivers of climate change.
It is essential to understand the different factors that contribute to climate forcing, as this knowledge can help us better understand how the Earth’s climate is changing and how we can mitigate the negative impacts of climate change.
Climate Change Indicators: Climate Forcing
This indicator measures the “radiative forcing” or heating effect caused by greenhouse gases in the atmosphere.

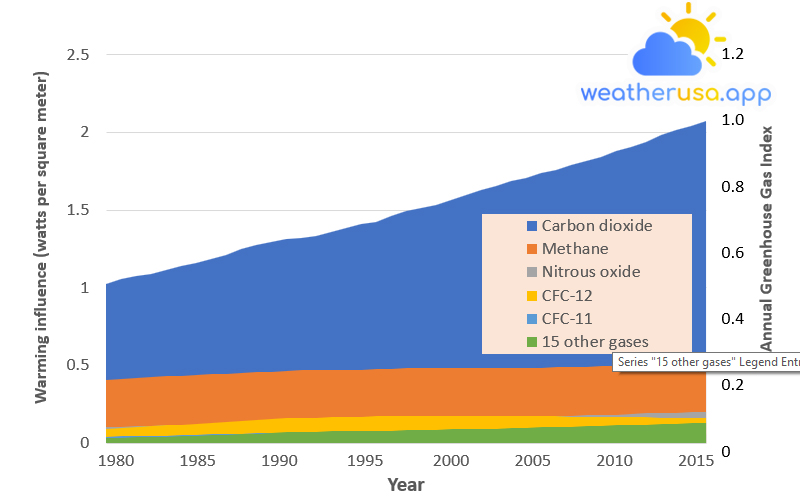
This figure shows the amount of radiative forcing caused by various greenhouse gases due to the change in the concentration of these gases in the Earth’s atmosphere since 1750. The radiative forcing is calculated in watts per square meter, representing the magnitude of the energy imbalance in the atmosphere. On the right side of the graph, radiative forcing has been converted to the Annual GHG Index for 1990, set to 1.0.
| Year | Carbon dioxide | Methane | Nitrous oxide | CFC-12 | CFC-11 | 15 other gases |
| 1979 | 1.027 | 406 | 104 | 92 | 0.04 | 31 |
| 1980 | 1.058 | 413 | 104 | 97 | 42 | 34 |
| 1981 | 1.077 | 0.42 | 107 | 102 | 44 | 36 |
| 1982 | 1.089 | 426 | 111 | 107 | 46 | 38 |
| 1983 | 1.115 | 429 | 113 | 113 | 48 | 41 |
| 1984 | 1.14 | 432 | 116 | 118 | 0.05 | 44 |
| 1985 | 1.162 | 437 | 118 | 123 | 53 | 47 |
| 1986 | 1.184 | 442 | 121 | 129 | 56 | 49 |
| 1987 | 1.211 | 447 | 0.12 | 135 | 58 | 53 |
| 1988 | 1.25 | 451 | 122 | 143 | 61 | 57 |
| 1989 | 1.275 | 455 | 126 | 149 | 63 | 61 |
| 1990 | 1.293 | 459 | 129 | 154 | 65 | 65 |
| 1991 | 1.312 | 463 | 131 | 158 | 66 | 69 |
| 1992 | 1.323 | 467 | 133 | 162 | 67 | 72 |
| 1993 | 1.334 | 467 | 134 | 164 | 67 | 74 |
| 1994 | 1.356 | 0.47 | 135 | 165 | 67 | 76 |
| 1995 | 1.383 | 472 | 136 | 168 | 67 | 77 |
| 1996 | 1.41 | 473 | 139 | 0.17 | 66 | 78 |
| 1997 | 1.426 | 474 | 142 | 171 | 66 | 79 |
| 1998 | 1.464 | 478 | 144 | 172 | 66 | 0.08 |
| 1999 | 1.495 | 481 | 148 | 173 | 65 | 82 |
| 2000 | 1.513 | 481 | 151 | 173 | 65 | 83 |
| 2001 | 1.535 | 0.48 | 153 | 174 | 64 | 85 |
| 2002 | 1.564 | 481 | 155 | 174 | 64 | 87 |
| 2003 | 1.6 | 483 | 157 | 174 | 63 | 89 |
| 2004 | 1.627 | 483 | 159 | 174 | 63 | 0.09 |
| 2005 | 1.655 | 482 | 162 | 173 | 62 | 92 |
| 2006 | 1.685 | 482 | 165 | 173 | 62 | 95 |
| 2007 | 1.71 | 484 | 167 | 172 | 61 | 98 |
| 2008 | 1.739 | 486 | 0.17 | 171 | 61 | 0.1 |
| 2009 | 1.76 | 489 | 172 | 171 | 0.06 | 103 |
| 2010 | 1.791 | 491 | 175 | 169 | 0.06 | 106 |
| 2011 | 1.817 | 492 | 178 | 169 | 59 | 109 |
| 2012 | 1.845 | 494 | 181 | 168 | 59 | 112 |
| 2013 | 1.882 | 496 | 183 | 167 | 58 | 114 |
| 2014 | 1.908 | 499 | 187 | 166 | 58 | 117 |
| 2015 | 1.938 | 504 | 0.19 | 165 | 58 | 119 |
| 2016 | 1.985 | 507 | 193 | 164 | 57 | 122 |
| 2017 | 2.013 | 509 | 195 | 163 | 57 | 124 |
| 2018 | 2.044 | 512 | 199 | 162 | 57 | 127 |
| 2019 | 2.076 | 516 | 202 | 161 | 57 | 129 |
Figure 1. Radiative Forcing Caused by Major Long-Lived Greenhouse Gases, 1979-2019
Data source: NOAA, 2020
Web update: April 2021
Units: Watts per square meter
Figure 2. Radiative Forcing Caused by Human Activities Since 1750
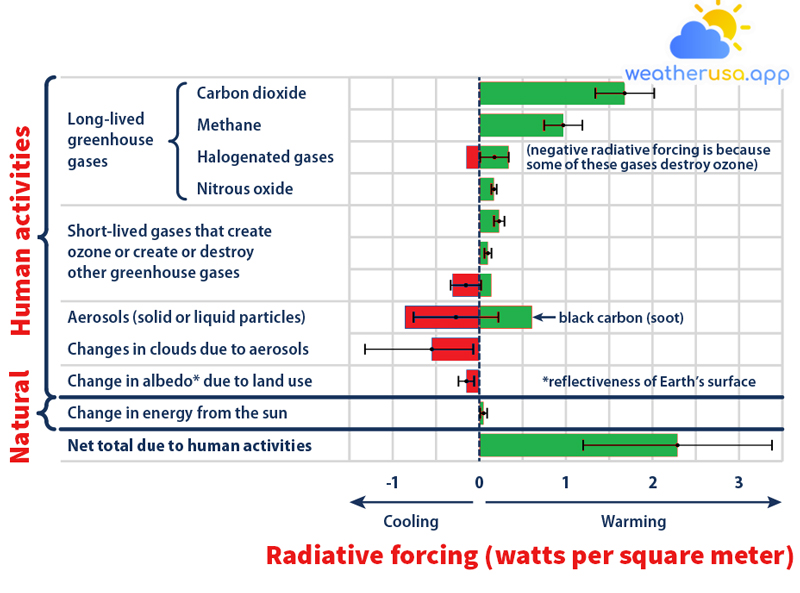
This figure represents the total amount of radiative forcing caused by human activities, including indirect effects, between 1750 and 2011. The radiative forcing is calculated in watts per square meter, representing the magnitude of the energy imbalance in the atmosphere. Each colored bar represents the scientists’ best guess, while thin black bars show the range of possible probabilities. The natural variation in energy received from the sun during this period is given as a reference.
Key Points
- The Annual GHG Index in 2019 was 1.45, representing a 45 percent increase in radiative forcing since 1990 (see Figure 1).
- Among the greenhouse gases shown in Figure 1, carbon dioxide has by far the largest share of radiative forcing since 1990, and its contribution continues to increase at a steady rate. Carbon dioxide alone accounts for a 36 percent increase in radiation forcing since 1990.
- Although the overall Annual GHG Index continues to rise, the rate of increase has slowed slightly since the reference year 1990. This change was primarily due to methane gas. As the production of CFCs has been phased out globally due to their damage to the ozone layer, concentrations have increased at a slower rate in recent years, and chlorofluorocarbon concentrations are decreasing (see Figure 1).
- Greenhouse gases produced by human activities have caused an overall warming effect on Earth’s climate since 1750. Carbon dioxide contributed the most to warming, followed by methane and black carbon. Although aerosol pollution and other activities cause cooling, the net result is that human activities are warming the Earth (see Figure 2).
Background
- When energy from the sun reaches Earth, the planet absorbs some of that energy and radiates the rest back into space as heat. The earth’s surface temperature depends on this balance between incoming and outgoing energy. Average conditions tend to remain constant unless the Earth experiences a force that changes its energy balance. A change in energy balance causes the Earth’s average temperature to become warmer or colder, leading to various other changes in the lower atmosphere, land, and oceans.
- Various physical and chemical changes can affect the global energy balance and cause changes in the Earth’s climate. While some of these changes are natural, some of them are human-induced. These changes are measured by the amount of warming or cooling they can produce, called “radial forcing.” Differences with a warming effect are called “positive” forcing, and changes with a cooling effect are called “negative.” When positive and negative forces are out of balance, the result is a change in Earth’s average surface temperature.
- Changes in greenhouse gas concentrations in the atmosphere affect radiative forcing. Greenhouse gases absorb the energy from the Earth’s surface, releasing the heat back into the lower atmosphere and warming the Earth’s surface. Human activities have caused increased concentrations of greenhouse gases in the atmosphere, which can remain for decades, centuries, or longer, so the corresponding warming effects will persist for a long time.
About the Indicator
Figure 1 of this indicator measures the average total radiative forcing of 20 long-lived greenhouse gases, including carbon dioxide, methane, and nitrous oxide. The results were calculated by the National Oceanic and Atmospheric Administration based on measured concentrations of gases in the atmosphere compared to concentrations present around 1750 before the Industrial Revolution began.
Since each gas has a different ability to absorb and emit energy, this indicator converts changes in greenhouse gas concentrations into a measure of the total radiative forcing caused by each gas. The radiative forcing is calculated in watts per square meter, representing the magnitude of the energy imbalance in the atmosphere.
NOAA also translates the total radiative forcing of these measured gases into an index value called the Annual Greenhouse Gas Index (right side of Figure 1). This number compares radiative forcing for a given year with radiative forcing in 1990, a typical base year for global agreements to monitor and reduce greenhouse gas emissions.
- Tropospheric ozone is a short-lived greenhouse gas.
- Emissions that indirectly cause greenhouse gases through chemical reactions in the atmosphere. For example, methane emissions also cause an increase in tropospheric ozone.
- Aerosol pollution consists of suspended solid and liquid particles that can reflect incoming sunlight.
- Black carbon, which, when deposited on snow and ice, can make the Earth’s surface darker and less reflective.
- Other factors, such as land use change, affect radiative forcing.
About the Data
Indicator Notes

Weather 01852 - Lowell MA

56°
mist
Feels like 55°05:30/19:53
60°F
/52°F
81%
1000 hPa
7 mi
9.22 mph


