Atmospheric Concentrations of Greenhouse Gases
Climate Change Indicators: Atmospheric Concentrations of Greenhouse Gases
This indicator describes how the levels of the leading greenhouse gases in the atmosphere have changed over time.
Figure 1. Global Atmospheric Concentrations of Carbon Dioxide Over Time
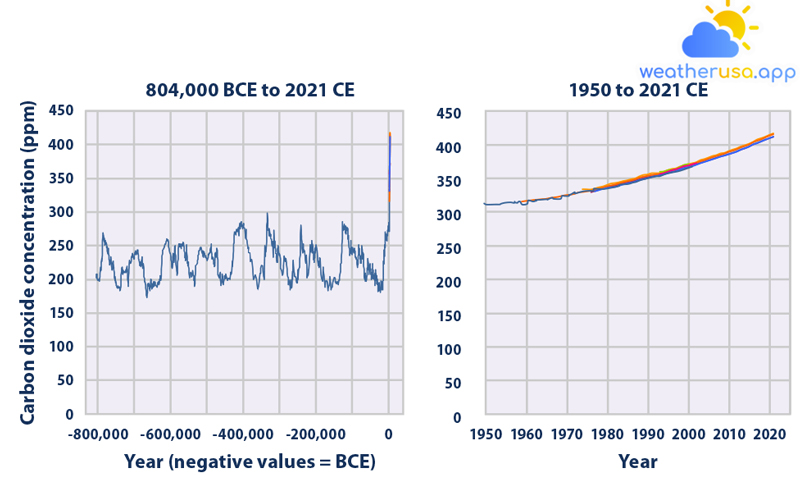
This figure shows carbon dioxide concentrations in the atmosphere from hundreds of thousands of years ago to 2021, measured in parts per million. The data comes from various historical ice core studies and recent air monitoring sites worldwide. Each row represents a different data source.
Figure 2. Global Atmospheric Concentrations of Methane Over Time
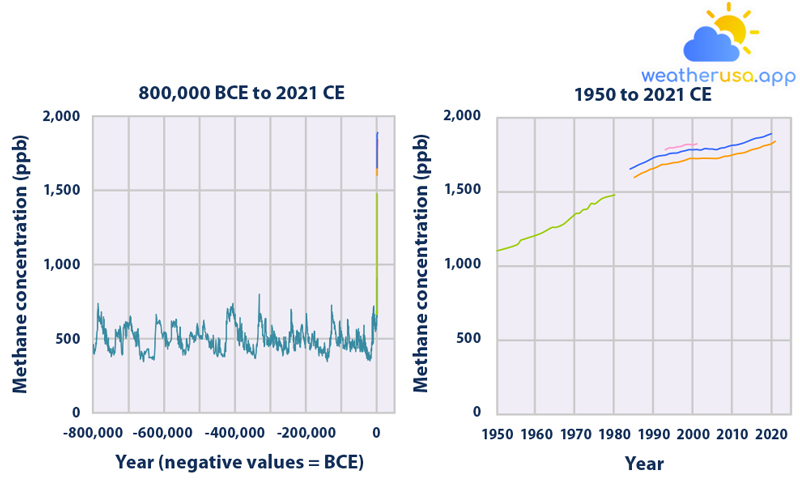
This figure shows atmospheric methane concentrations from hundreds of thousands of years ago to 2021, measured in parts per billion. The data comes from various historical ice core studies and recent air monitoring sites worldwide. Each row represents a different data source.
Figure 3. Global Atmospheric Concentrations of Nitrous Oxide Over Time
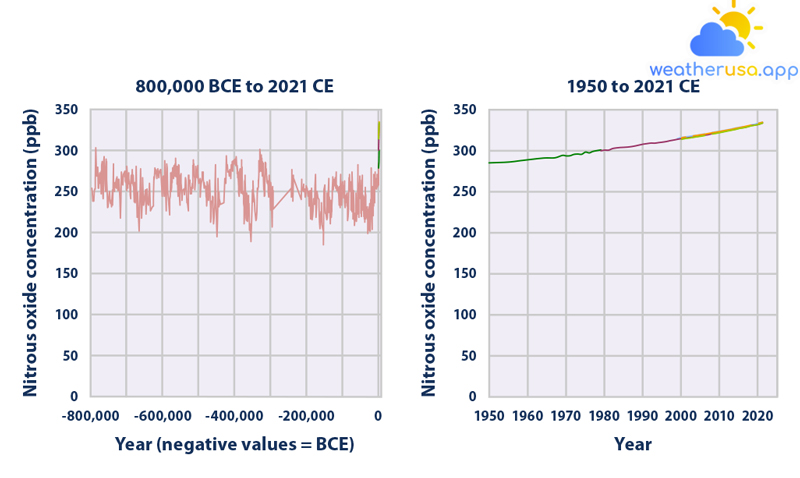
This figure shows nitrous oxide concentrations in the atmosphere from hundreds of thousands of years ago to 2021, measured in parts per billion. The data comes from various historical ice core studies and recent air monitoring sites worldwide. Each row represents a different data source.
Figure 4. Global Atmospheric Concentrations of Selected Halogenated Gases, 1978–2021
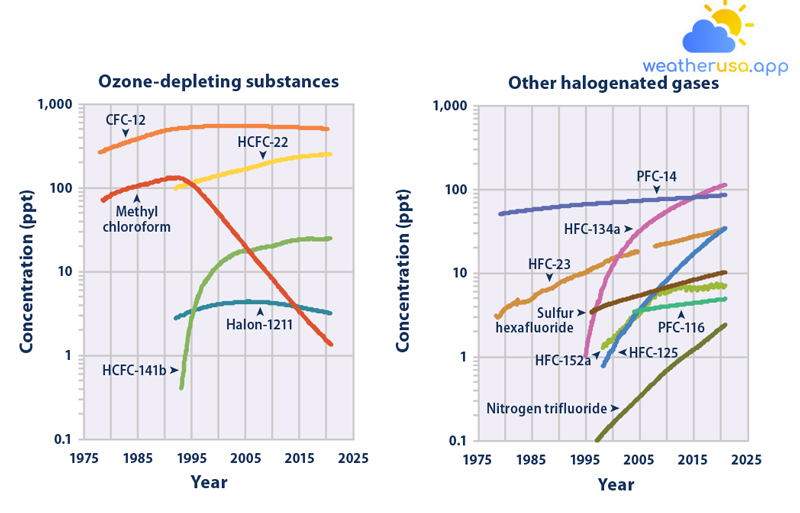
This figure shows the concentrations of several halogenated gases in the atmosphere, measured in parts per trillion. The data comes from monitoring sites around the world. Note that the scale is increased by a factor of 10. This is because the concentrations of the various halogenated gases can vary by several orders of magnitude. The numbers after the name of each gas are used to indicate the specific types of those particular gases.
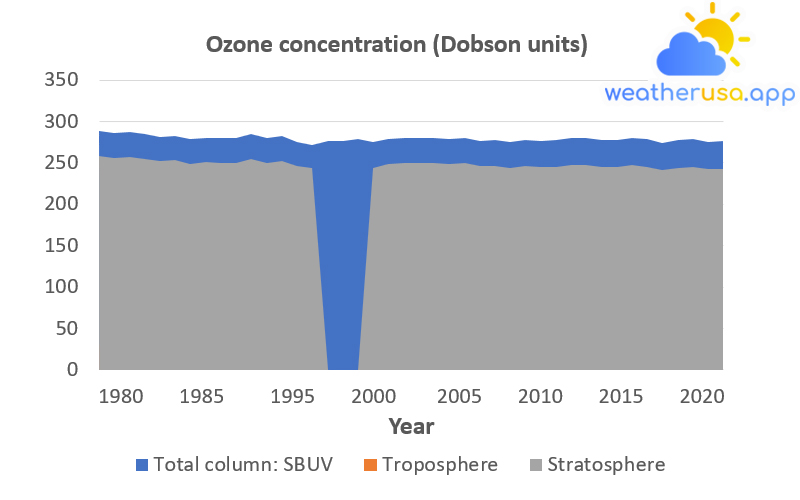
Figure 5. Global Atmospheric Concentrations of Ozone, 1979–2020

This figure shows the yearly amount of ozone in the Earth’s atmosphere based on satellite measurements. The sum represents the “thickness” or density of ozone in all layers of the Earth’s atmosphere, which is called total column ozone and is measured in Dobsonian units. Higher numbers mean more ozone. Figure 5 shows how this ozone is partitioned between the troposphere and stratosphere for most years. From 1994 to 1996, only the total was available due to limited satellite coverage.
| Year | Total column: SBUV | Troposphere | Stratosphere |
| 1979 | 2.885.425.341 | 3.024.300.399 | 2.582.995.301 |
| 1980 | 2.854.857.538 | 2.964.155.844 | 2.558.441.954 |
| 1981 | 2.868.615.908 | 2.982.575.237 | 2.570.358.385 |
| 1982 | 2.846.232.209 | 2.981.366.448 | 2.548.095.565 |
| 1983 | 2.814.472.355 | 297.303.762 | 2.517.168.593 |
| 1984 | 2.826.520.321 | 2.970.534.982 | 2.529.466.823 |
| 1985 | 2.787.760.214 | 2.987.996.771 | 2.488.960.536 |
| 1986 | 2.804.833.358 | 2.970.761.845 | 2.507.757.174 |
| 1987 | 2.804.320.295 | 303.917.555 | 250.040.274 |
| 1988 | 279.824.351 | 3.054.481.897 | 2.492.795.321 |
| 1989 | 2.842.744.245 | 301.188.484 | 2.541.555.761 |
| 1990 | 2.803.666.471 | 3.005.851.543 | 2.503.081.316 |
| 1991 | 2.822.635.986 | 2.994.252.255 | 252.321.076 |
| 1992 | 2.755.363.445 | 2.953.175.101 | 2.460.045.935 |
| 1993 | 2.715.864.837 | 2.789.200.375 | 24.369.448 |
| 1994 | 2.766.751.021 | ||
| 1995 | 2.761.967.865 | ||
| 1996 | 2.783.669.026 | ||
| 1997 | 2.750.610.352 | 3.088.321.755 | 2.441.778.176 |
| 1998 | 2.790.761.106 | 3.040.959.091 | 2.486.665.197 |
| 1999 | 2.796.856.512 | 3.029.315.427 | 2.493.924.969 |
| 2000 | 2.805.171.256 | 3.031.162.023 | 2.502.055.054 |
| 2001 | 2.798.883.338 | 3.008.413.138 | 2.498.042.024 |
| 2002 | 2.782.098.547 | 2.998.787.733 | 2.482.219.774 |
| 2003 | 2.797.477.386 | 3.013.594.675 | 2.496.117.919 |
| 2004 | 2.766.686.602 | 3.022.419.357 | 2.464.444.667 |
| 2005 | 277.689.378 | 3.134.440.194 | 246.344.976 |
| 2006 | 2.755.851.902 | 3.175.725.212 | 243.827.938 |
| 2007 | 2.779.547.966 | 3.174.429.641 | 2.462.105.002 |
| 2008 | 2.768.623.944 | 3.152.643.423 | 2.453.359.602 |
| 2009 | 2.772.883.898 | 3.207.092.713 | 2.452.174.626 |
| 2010 | 2.799.723.456 | 3.244.985.166 | 2.475.224.939 |
| 2011 | 2.797.765.871 | 3.276.822.418 | 247.008.363 |
| 2012 | 2.779.641.987 | 327.602.542 | 2.452.039.445 |
| 2013 | 2.775.365.288 | 3.272.291.133 | 2.448.136.174 |
| 2014 | 2.798.094.604 | 3.293.376.974 | 2.468.756.907 |
| 2015 | 2.788.672.805 | 3.329.206.285 | 2.455.752.177 |
| 2016 | 2.744.976.433 | 3.326.473.034 | 2.412.329.129 |
| 2017 | 2.774.280.135 | 3.341.408.626 | 2.440.139.272 |
| 2018 | 2.783.970.894 | 3.362.079.956 | 2.447.762.899 |
| 2019 | 2.756.600.871 | 3.348.758.996 | 2.421.724.971 |
| 2020 | 2.760.855.724 | 3.390.806.791 | 2.421.775.044 |
Figure 5. Global Atmospheric Concentrations of Ozone, 1979-2020
Data source: NASA, 2013, 2021, 2022
Web update: July 2022
Units: Dobson units
Key Points
- Global atmospheric concentrations of carbon dioxide, methane, nitrous oxide, and some manufactured greenhouse gases have increased significantly over the past several hundred years (see Figures 1, 2, 3, and 4).
- Historical measurements show that current global atmospheric concentrations of carbon dioxide, methane, and nitrous oxide are unprecedented compared to the past 800,000 years (see Figures 1, 2, and 3).
- Carbon dioxide concentrations have increased substantially since the beginning of the industrial era, from an annual average of 280 ppm in the late 17th century to 414 ppm in 2021 — a 48 percent increase. Almost all of this increase is due to human activity.
- The methane concentration in the atmosphere has more than doubled since pre-industrial times, reaching more than 1,800 ppb in recent years (see the range of measurements for 2020 and 2021 in Figure 2). This increase is mainly caused by agriculture and the use of fossil fuels.
- Over the past 800,000 years, atmospheric concentrations of nitrous oxide have rarely exceeded 280 ppb. Levels have increased since the 1920s but reached a new high of 334 ppb in 2021 (average of four sites in Figure 3). This increase is mainly due to agriculture.
- Concentrations of many of the halogenated gases shown in Figure 4 were essentially zero a few decades ago but have increased rapidly as they have been incorporated into industrial products and processes. Some of these chemicals have been or are currently being phased out because they are ozone-depleting substances, damaging the Earth’s protective ozone layer. As a result, concentrations of many major ozone-depleting gases have begun to stabilize or decline (see Figure 4, left panel). However, concentrations of other halogenated gases continued to rise, mainly where these gases emerged as substitutes for ozone-depleting chemicals.
- Overall, the total amount of ozone in the atmosphere decreased by more than 4 percent between 1979 and 2020 (see Figure 5). All of the declines occurred in the stratosphere, with most of the decline occurring between 1979 and 1994. Changes in stratospheric ozone reflect the effect of ozone-depleting substances. These chemicals have been released into the air for many years, but recently international efforts have reduced emissions and phased out their use.
- Globally, the amount of ozone in the troposphere increased by about 12 percent between 1979 and 2020 (see Figure 5).
Water vapor as a greenhouse gas
Water vapor is the most abundant greenhouse gas in the atmosphere. Human activity has little direct effect on atmospheric water vapor concentrations, mainly through irrigation and deforestation, and is therefore not included in this indicator.
Surface warming caused by human production of other greenhouse gases, however, leads to an increase in atmospheric water vapor, as higher temperatures facilitate the evaporation of water and its stay in the air in the form of steam. This creates a positive “feedback loop,” in which warming leads to more warming.
Background
- Since the beginning of the Industrial Revolution in the 1700s, humans have added significant amounts of greenhouse gases to the atmosphere by burning fossil fuels, cutting down forests, and performing other activities. When greenhouse gases are released into the atmosphere, many remain there for long periods, from decades to millennia. Over time, these gases are removed from the atmosphere by chemical reactions or emission sinks, such as oceans and vegetation, which absorb greenhouse gases from the atmosphere. However, due to human activity, these gases enter the atmosphere faster than they are removed, and thus their concentration increases.
- Carbon dioxide, methane, nitrous oxide, and some manufactured gases called halogenated gases mix well in the global atmosphere because of their relatively long lifetimes and because of wind transport. The concentration of these greenhouse gases is measured in parts per million, parts per billion, or parts per trillion by volume. In other words, a concentration of 1 ppb for a given gas means that there is one molecule of that gas in every 1 billion air molecules. Some halogenated gases are considered significant greenhouse gases because of their very high global warming potential and long lifetimes in the atmosphere, even though they exist only in a few ppt.
- Ozone is also a greenhouse gas, but it differs from other greenhouse gases in several ways. The effects of ozone depend on its altitude or where the gas is vertically in the atmosphere. Most ozone occurs naturally in a layer of the atmosphere called the stratosphere, approximately 6 to 30 miles above the Earth’s surface. Stratospheric ozone has a modest net warming effect on the planet. Still, it is suitable for life on Earth because it absorbs harmful ultraviolet radiation from the sun and prevents it from reaching the Earth’s surface. In the troposphere—the layer of the atmosphere close to the ground—ozone is an air pollutant that is harmful to breathing, a significant component of urban smog, and an important greenhouse gas contributing to climate change. Unlike the other major greenhouse gases
About the Indicator
- This indicator describes the concentration of greenhouse gases in the atmosphere. It focuses on the leading greenhouse gases that are produced by human activity.
- For carbon dioxide, methane, nitrous oxide, and halogenated gases, recent measurements come from monitoring stations around the world. In contrast, older air measurements come from bubbles trapped in ice sheets from Antarctica and Greenland. By determining the age of the ice sheets and the concentrations of gases trapped inside, scientists can determine what the atmosphere was like thousands of years ago.
- This indicator also shows data from satellite instruments that measure the ozone density in the troposphere, stratosphere, and “total column,” or all layers of the atmosphere. These satellite data are routinely compared with ground-based instruments to confirm their accuracy. Ozone data were globally averaged yearly to compensate for regional and seasonal variations.
About the Data
Notes on the indicator
This indicator includes several of the most critical halogenated gases, but others are not shown. Many other halogenated gases are also greenhouse gases, but Figure 4 is limited to typical examples representing most of these gases’ significant types. The indicator does not address other climate pollutants by reflecting or absorbing energy.
For example, sulfate particles can reflect sunlight away from Earth, while black carbon aerosols absorb the energy. Data for nitrogen fluoride (Figure 4) reflect modeled averages based on measurements taken in the Northern Hemisphere and some locations in the Southern Hemisphere to represent global average concentrations over time. Global ozone averages only cover the area between 50°N and 50°S.
Data Sources
Global measurements of the concentration of carbon dioxide (Figure 1), methane (Figure 2), and nitrous oxide (Figure 3) in the atmosphere come from various monitoring programs and studies published in peer-reviewed literature. Data on global atmospheric concentrations for selected halogenated gases (Figure 4) were compiled by the Advanced Global Atmospheric Gases Experiment and the National Oceanic and Atmospheric Administration.
A similar figure for many of these gases appears in the Intergovernmental Panel on Climate Change’s Fifth Assessment Report. Satellite ozone measurements were processed by the National Aeronautics and Space Administration and verified with ground-based measurements collected by the National Oceanic and Atmospheric Administration.

Weather 01852 - Lowell MA

58°
light rain
Feels like 57°05:30/19:53
62°F
/54°F
71%
1003 hPa
7 mi
4.61 mph


