Arctic Sea Ice
Climate Change Indicators: Arctic Sea Ice
This indicator tracks the extent, age, and melting season of sea ice in the Arctic Ocean.
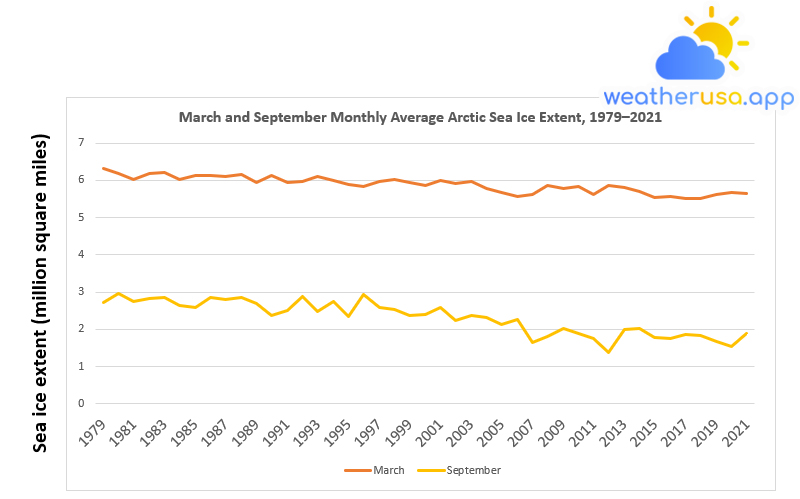
Figure 1. March and September Monthly Average Arctic Sea Ice Extent, 1979–2021

This figure shows the extent of Arctic sea ice for September and March of each year from 1979 to 2021. September and March are when the minimum and maximum extent occur each year.
| Year | March | September |
| 1979 | 6.308909 | 2.72202 |
| 1980 | 6.193079 | 2.961404 |
| 1981 | 6.034777 | 2.756769 |
| 1982 | 6.193079 | 2.818546 |
| 1983 | 6.212384 | 2.853295 |
| 1984 | 6.015472 | 2.629356 |
| 1985 | 6.135163 | 2.586884 |
| 1986 | 6.142885 | 2.861017 |
| 1987 | 6.108136 | 2.810824 |
| 1988 | 6.16219 | 2.845573 |
| 1989 | 5.953695 | 2.706576 |
| 1990 | 6.127441 | 2.370667 |
| 1991 | 5.953695 | 2.498081 |
| 1992 | 5.976861 | 2.884183 |
| 1993 | 6.104275 | 2.471054 |
| 1994 | 6.003889 | 2.756769 |
| 1995 | 5.891919 | 2.347501 |
| 1996 | 5.837865 | 2.926654 |
| 1997 | 5.973 | 2.583023 |
| 1998 | 6.023194 | 2.525108 |
| 1999 | 5.945973 | 2.362945 |
| 2000 | 5.876475 | 2.413138 |
| 2001 | 5.992306 | 2.598468 |
| 2002 | 5.926668 | 2.250976 |
| 2003 | 5.976861 | 2.362945 |
| 2004 | 5.787671 | 2.308891 |
| 2005 | 5.671841 | 2.123562 |
| 2006 | 5.567593 | 2.262559 |
| 2007 | 5.613925 | 1.648656 |
| 2008 | 5.861031 | 1.810819 |
| 2009 | 5.78381 | 2.030897 |
| 2010 | 5.845587 | 1.880318 |
| 2011 | 5.617786 | 1.760626 |
| 2012 | 5.868753 | 1.378385 |
| 2013 | 5.803115 | 2.011592 |
| 2014 | 5.698868 | 2.015453 |
| 2015 | 5.548288 | 1.783792 |
| 2016 | 5.559871 | 1.749043 |
| 2017 | 5.5174 | 1.861012 |
| 2018 | 5.521261 | 1.849429 |
| 2019 | 5.625508 | 1.683405 |
| 2020 | 5.687285 | 1.544409 |
| 2021 | 5.652536 | 1.899623 |
Figure 1. March and September Monthly Average Arctic Sea Ice Extent, 1979-2021
Data source: NSIDC, 2021
Web update: July 2022
Units: Square miles
Figure 2. Age of Arctic Sea Ice at Minimum September Week, 1984–2021
This figure shows the Arctic sea ice extent distribution by age group during September, with a minor ice extent for each year.
The total volume in Figure 2 differs from that in Figure 1 because Figure 1 shows a monthly average, while Figure 2 shows conditions over a week.
The total volume in Figure 2 differs from that in Figure 1 because Figure 1 shows a monthly average, while Figure 2 shows conditions over a week.
| Year | 1YI | 2YI | 3YI | 4YI | 5+YI |
| 1984 | 468341.9 | 284171.2 | 240927.7 | 233205.7 | 812745 |
| 1985 | 427029 | 329345.1 | 241700 | 215058.9 | 911973.3 |
| 1986 | 553284.4 | 237452.8 | 259846.8 | 194981.6 | 945950.3 |
| 1987 | 440928.7 | 297684.8 | 192278.9 | 223553.2 | 993440.9 |
| 1988 | 675678.8 | 220850.4 | 209267.4 | 153668.7 | 1070661 |
| 1989 | 787648.4 | 269113.2 | 137066.3 | 123552.7 | 831277.9 |
| 1990 | 521237.9 | 391121.5 | 179537.5 | 83398.07 | 696914.4 |
| 1991 | 649037.7 | 295368.2 | 288418.3 | 150193.7 | 638226.9 |
| 1992 | 831664.1 | 362936 | 216217.2 | 189576.2 | 573747.8 |
| 1993 | 519693.5 | 388032.7 | 252510.8 | 111969.6 | 606952.6 |
| 1994 | 835911.2 | 323939.7 | 314673.3 | 138610.7 | 579925.4 |
| 1995 | 539770.8 | 409268.3 | 211197.9 | 147877.1 | 535909.8 |
| 1996 | 1083403 | 260619 | 279151.9 | 155213.1 | 548265.1 |
| 1997 | 672203.9 | 515832.5 | 194981.6 | 178765.3 | 484172.1 |
| 1998 | 722011 | 308495.6 | 339769.9 | 125869.3 | 540929.1 |
| 1999 | 467955.8 | 324325.8 | 241700 | 245174.9 | 572203.4 |
| 2000 | 759462.9 | 224325.4 | 213128.4 | 159074.1 | 613516.3 |
| 2001 | 852513.6 | 402704.6 | 178765.3 | 149035.4 | 575678.3 |
| 2002 | 467955.8 | 379152.3 | 276063 | 141699.5 | 544017.9 |
| 2003 | 652126.5 | 241313.8 | 254055.2 | 193823.3 | 565639.7 |
| 2004 | 631663.1 | 353669.6 | 169112.7 | 146332.7 | 486874.8 |
| 2005 | 591122.4 | 341700.4 | 224711.5 | 71042.8 | 466025.3 |
| 2006 | 795756.5 | 308109.5 | 230503 | 102317.1 | 404635.1 |
| 2007 | 488033.1 | 305792.9 | 122780.5 | 66409.57 | 235908.4 |
| 2008 | 971046.9 | 167954.4 | 98842.15 | 75289.92 | 234750.1 |
| 2009 | 949039.1 | 303090.2 | 71042.8 | 48262.77 | 215445 |
| 2010 | 765254.5 | 453283.9 | 108880.8 | 29729.87 | 135908 |
| 2011 | 744018.9 | 382627.2 | 231275.2 | 27413.25 | 85714.68 |
| 2012 | 526257.2 | 269113.2 | 105792 | 72587.21 | 41312.93 |
| 2013 | 995371.4 | 333206.2 | 155985.3 | 55212.61 | 69112.29 |
| 2014 | 797301 | 413515.4 | 167568.3 | 102703.2 | 64865.16 |
| 2015 | 713516.8 | 295368.2 | 194595.5 | 64479.06 | 95753.34 |
| 2016 | 747107.7 | 279538 | 108880.8 | 72973.31 | 74903.82 |
| 2017 | 925486.9 | 374905.2 | 82625.86 | 34363.09 | 64092.96 |
| 2018 | 683400.8 | 429731.7 | 247105.4 | 24710.54 | 40154.62 |
| 2019 | 784559.6 | 203089.7 | 147491 | 144788.3 | 21235.62 |
| 2020 | 609269.2 | 285329.5 | 102317.1 | 67953.98 | 86872.99 |
| 2021 | 1047495 | 226255.9 | 159074.1 | 61390.24 | 52123.79 |
Figure 2. Age of Arctic Sea Ice at Minimum September Week, 1984-2021
Data source: NSIDC, 2021
Web update: July 2022
Units: Square miles
Figure 3. Arctic Sea Ice Melt Season, 1979–2020
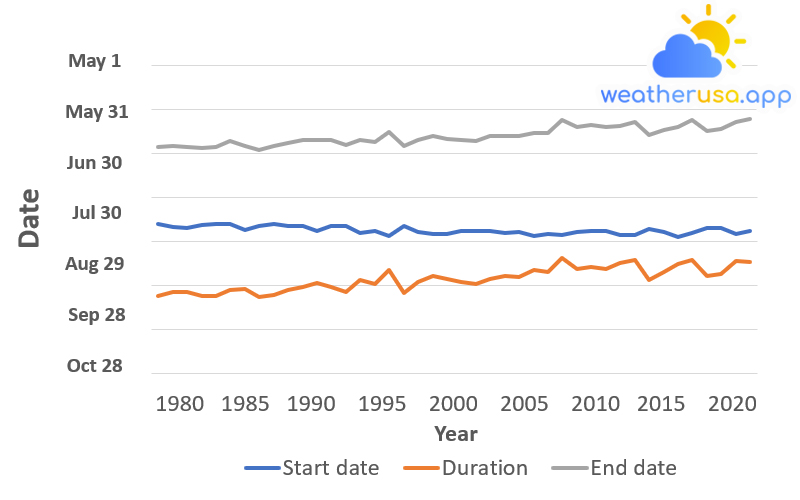
This figure shows the timing of the Arctic sea ice melt season for each year. The shaded band extends from the date when the ice begins to melt steadily until the date when it starts to refreeze.
| Year | Start date | Duration | End date |
| 1979 | 169.275 | 88.412 | 257.687 |
| 1980 | 166.438 | 91.913 | 258.351 |
| 1981 | 164.909 | 91.975 | 256.884 |
| 1982 | 168.775 | 87.8 | 256.575 |
| 1983 | 169.446 | 87.883 | 257.329 |
| 1984 | 169.776 | 94.335 | 264.111 |
| 1985 | 162.98 | 95.595 | 258.575 |
| 1986 | 167.216 | 87.146 | 254.362 |
| 1987 | 169.926 | 89.194 | 259.12 |
| 1988 | 167.188 | 94.337 | 261.525 |
| 1989 | 166.974 | 97.891 | 264.865 |
| 1990 | 162.392 | 102.494 | 264.886 |
| 1991 | 167.042 | 97.833 | 264.875 |
| 1992 | 167.529 | 92.476 | 260.006 |
| 1993 | 159.173 | 106.106 | 265.279 |
| 1994 | 161.598 | 101.178 | 262.776 |
| 1995 | 156.285 | 117.699 | 273.984 |
| 1996 | 167.813 | 91.299 | 259.112 |
| 1997 | 161.075 | 103.818 | 264.893 |
| 1998 | 158.665 | 110.804 | 269.47 |
| 1999 | 158.979 | 107.38 | 266.359 |
| 2000 | 161.866 | 103.601 | 265.467 |
| 2001 | 162.264 | 101.587 | 263.851 |
| 2002 | 162.108 | 107.646 | 269.754 |
| 2003 | 159.808 | 110.657 | 270.466 |
| 2004 | 161.179 | 109.281 | 270.46 |
| 2005 | 155.991 | 117.306 | 273.297 |
| 2006 | 158.285 | 115.495 | 273.78 |
| 2007 | 157.275 | 131.019 | 288.294 |
| 2008 | 160.991 | 118.794 | 279.785 |
| 2009 | 161.969 | 120.603 | 282.573 |
| 2010 | 161.968 | 118.685 | 280.653 |
| 2011 | 156.958 | 124.919 | 281.877 |
| 2012 | 157.354 | 128.453 | 285.807 |
| 2013 | 164.192 | 106.353 | 270.545 |
| 2014 | 161.211 | 115.147 | 276.358 |
| 2015 | 155.583 | 124.049 | 279.632 |
| 2016 | 159.16 | 128.902 | 288.063 |
| 2017 | 165.139 | 110.19 | 275.33 |
| 2018 | 165.615 | 112.693 | 278.307 |
| 2019 | 158.31 | 127.937 | 286.247 |
| 2020 | 162.057 | 126.871 | 288.928 |
Figure 3. Arctic Sea Ice Melt Season, 1979-2020
Data source: NASA, 2021
Web update: July 2022
Units: Julian days (start date and end date); days (duration)
Dwindling Arctic Sea Ice
Key points
- September 2012 had the lowest sea ice extent on record, 44% below that month’s 1981-2010 average. For March, the lowest sea ice extent on record was recorded in 2017, 7.4% less than the 1981-2010 average (see Figure 1).
- Sea ice extent in September 2021 was the 12th smallest on record. That was more than 577,000 square miles less than the historical average from 1981 to 2010 for that month (see Figure 1) — a difference more than twice the size of Texas.
- All months have shown a negative trend in sea ice extent over the past few decades. The most significant year-over-year decreases occurred during the summer and fall months.
- Evidence from the age of Arctic sea ice suggests that fewer ice patches persist for several years (see Figure 2). The proportion of five-year-old or older sea ice has declined significantly over the recorded period, from over 40% September ice on average in the 1980s to less than 10% since 2010.
An increasing percentage of ice arctic sea is only one or two years old. Younger multi-year ice means the ice cover is thinning, making it more vulnerable to further melting. - Since 1979, the length of the Arctic sea ice melt season has increased by 39 days (see Figure 3). On average, Arctic sea ice begins to melt nine days earlier and resumes freezing 30 days later than before (see Figure 3).
Background
- Sea ice is an integral part of the Arctic Ocean. During the dark winter, sea ice covers the entire Arctic Ocean. Some of this ice melts in the summer due to warmer temperatures and long hours of sunshine.
Sea ice typically reaches its minimum thickness and extent in mid-September, when the area covered by ice is roughly half the size of the winter maximum. The ice then begins to expand again during the fall and winter.
- The extent of the area covered by Arctic sea ice is an essential indicator of changes in global climate, as warmer air and water temperatures reduce the amount of sea ice present.
Because sea ice is light in color, it reflects more sunlight to space than liquid water, thus playing an essential role in maintaining the Earth’s energy balance and helping to keep oceans cool polar regions.
Sea ice also keeps the air cool by forming a barrier between the cold air above and the warmer water below. As the amount of sea ice decreases, the cooling effect of the Arctic region is reduced.
This may initiate a “feedback loop” whereby ocean warming caused by more absorption of solar energy leads to an even more significant loss of sea ice and further warming.
- The age of sea ice is also an important indicator of Arctic conditions, as ice accumulated over many years is generally thicker and more robust than younger ice.
The loss of older ice suggests the Arctic ice cover is thinning. Evidence also indicates that the melt season has become longer; ice begins to melt earlier in the year and freeze later than before.
- Changes in sea ice can directly affect the health of Arctic ecosystems. Mammals such as polar bears and walruses depend on the presence of sea ice to hunt, breed and migrate.
Due to reduced sea ice cover and thickness, these animals are threatened by declining birth rates and restricted access to food sources. Impacts on Arctic wildlife and the loss of ice itself are already restricting the traditional subsistence hunting lifestyle of indigenous Arctic peoples such as the Yup’ik, Iñupiat, and Inuit.
- While shrinking sea ice can have adverse ecological effects, it can also present trade and economic opportunities.
For example, reduced sea ice opens shipping lanes and increases access to natural resources in the Arctic region.
About the indicator
- Figure 1 shows the extent of Arctic sea ice from 1979, when routine satellite monitoring began, to 2021. Sea ice extent is defined as the area of the ocean where at least 15% of the surface is frozen.
This threshold was chosen because scientists have found that it best approximates the ice’s edge. While data is collected throughout the year, this indicator focuses on months when sea ice typically reaches its minimum and maximum extent.
September is usually when sea ice extent goes to its annual minimum after melting in the spring and summer. Conversely, March is generally when sea ice reaches its maximum extent after the winter freeze-up.
- Figure 2 examines the age of the ice present in the Arctic during the week of September, which has a minor extent of the ice. By combining daily satellite images, wind measurements, and data from surface buoys that move with the ice, scientists can track specific patches of ice over time.
This tracking allows them to calculate the ice age in different parts of the Arctic. Although satellites began collecting data in 1979, Figure 2 only shows data from 1984. It is impossible to know the entire age distribution until the ice has been tracked for at least five years.
- Figure 3 shows the start and end dates of each year’s Arctic sea ice melt season, starting in 1979. It is based on the same satellite instruments as Figure 1.
Here, the melting season’s start date is when the satellites detect constant humidity on the surface of ice and snow; the end date is when the surface air temperature remains consistently at or below freezing, and ice begins to grow in the open sea.
About the Data
Indicator Notes
Rising air and ocean temperatures associated with climate change are not the only factors contributing to shrinking sea ice.
Other conditions likely to be affected by climate change, such as fluctuations in the ocean and atmospheric circulation and annual and decadal natural variability, also affect sea ice extent ice is an imperfect science, as there are instances where a small amount of older ice may exist in an area classified as younger, or vice versa.
Other conditions likely to be affected by climate change, such as fluctuations in the ocean and atmospheric circulation and annual and decadal natural variability, also affect sea ice extent ice is an imperfect science, as there are instances where a small amount of older ice may exist in an area classified as younger, or vice versa.
Data Sources
The data for Figures 1 and 2 were provided by the National Snow and Ice Data Center, which produces various reports and a seasonal newsletter analyzing Arctic sea ice data.

Weather 01852 - Lowell MA

77°
clear sky
Feels like 76°05:31/19:51
81°F
/69°F
30%
1003 hPa
7 mi
6.91 mph


