Antarctic Sea Ice
Sea ice
Sea ice arises when seawater freezes. Because ice is lighter than water, it floats on the ocean’s surface. Sea ice covers about 7% of the Earth’s surface and about 12% of the world’s oceans.
Much of the world’s sea ice is covered in polar ice sheets in the Earth’s polar regions: the Arctic ice sheet of the Arctic Ocean and the Antarctic ice sheet of the Southern Ocean. Polar packs undergo a significant annual cycle at the surface level, a natural process that depends on Arctic ecosystems, including those of the oceans.
Due to the action of winds, currents, and temperature fluctuations, sea ice is very dynamic, resulting in a wide variety of ice types and characteristics. Sea ice can be contrasted with icebergs, ice sheets, or glaciers pouring into the ocean. Depending on the location, sea ice expanses may also incorporate icebergs.
Climate Change Indicators: Antarctic Sea Ice
This indicator tracks the extent of sea ice around Antarctica.
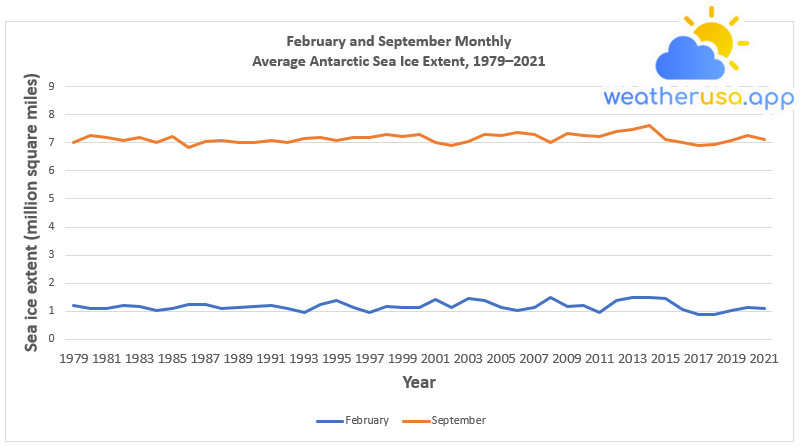
Figure 1. February and September Monthly Average Antarctic Sea Ice Extent, 1979–2021

This figure shows the extent of sea ice in Antarctica for February and September from 1979 to 2021. The minimum and maximum sea ice extent typically occur in February and September.
| Year | February | September |
| 1979 | 1.212361 | 7.027059 |
| 1980 | 1.088808 | 7.266443 |
| 1981 | 1.108113 | 7.1815 |
| 1982 | 1.2085 | 7.084975 |
| 1983 | 1.185334 | 7.177639 |
| 1984 | 1.034754 | 7.015476 |
| 1985 | 1.09653 | 7.22011 |
| 1986 | 1.231666 | 6.826286 |
| 1987 | 1.254832 | 7.046364 |
| 1988 | 1.115835 | 7.069531 |
| 1989 | 1.150584 | 6.996171 |
| 1990 | 1.173751 | 7.023198 |
| 1991 | 1.220083 | 7.069531 |
| 1992 | 1.09653 | 7.007754 |
| 1993 | 0.957533 | 7.158334 |
| 1994 | 1.235527 | 7.185361 |
| 1995 | 1.374524 | 7.092697 |
| 1996 | 1.150584 | 7.193083 |
| 1997 | 0.961394 | 7.1815 |
| 1998 | 1.154445 | 7.297331 |
| 1999 | 1.146723 | 7.22011 |
| 2000 | 1.123557 | 7.29347 |
| 2001 | 1.409273 | 7.015476 |
| 2002 | 1.142862 | 6.907368 |
| 2003 | 1.463327 | 7.06567 |
| 2004 | 1.382246 | 7.305053 |
| 2005 | 1.146723 | 7.258721 |
| 2006 | 1.023171 | 7.37069 |
| 2007 | 1.119696 | 7.281887 |
| 2008 | 1.501937 | 7.007754 |
| 2009 | 1.154445 | 7.320497 |
| 2010 | 1.200778 | 7.258721 |
| 2011 | 0.972977 | 7.235554 |
| 2012 | 1.370663 | 7.417022 |
| 2013 | 1.482632 | 7.486521 |
| 2014 | 1.482632 | 7.629379 |
| 2015 | 1.467188 | 7.119724 |
| 2016 | 1.077225 | 7.007754 |
| 2017 | 0.884174 | 6.91509 |
| 2018 | 0.899618 | 6.934395 |
| 2019 | 1.023171 | 7.077253 |
| 2020 | 1.127418 | 7.274165 |
| 2021 | 1.092669 | 7.123585 |
Figure 1. February and September Monthly Average Antarctic Sea Ice Extent, 1979–2021
Data source: NSIDC, 2022
Web update: July 2022
Units: million square miles
Seasonal Antarctic Sea Ice
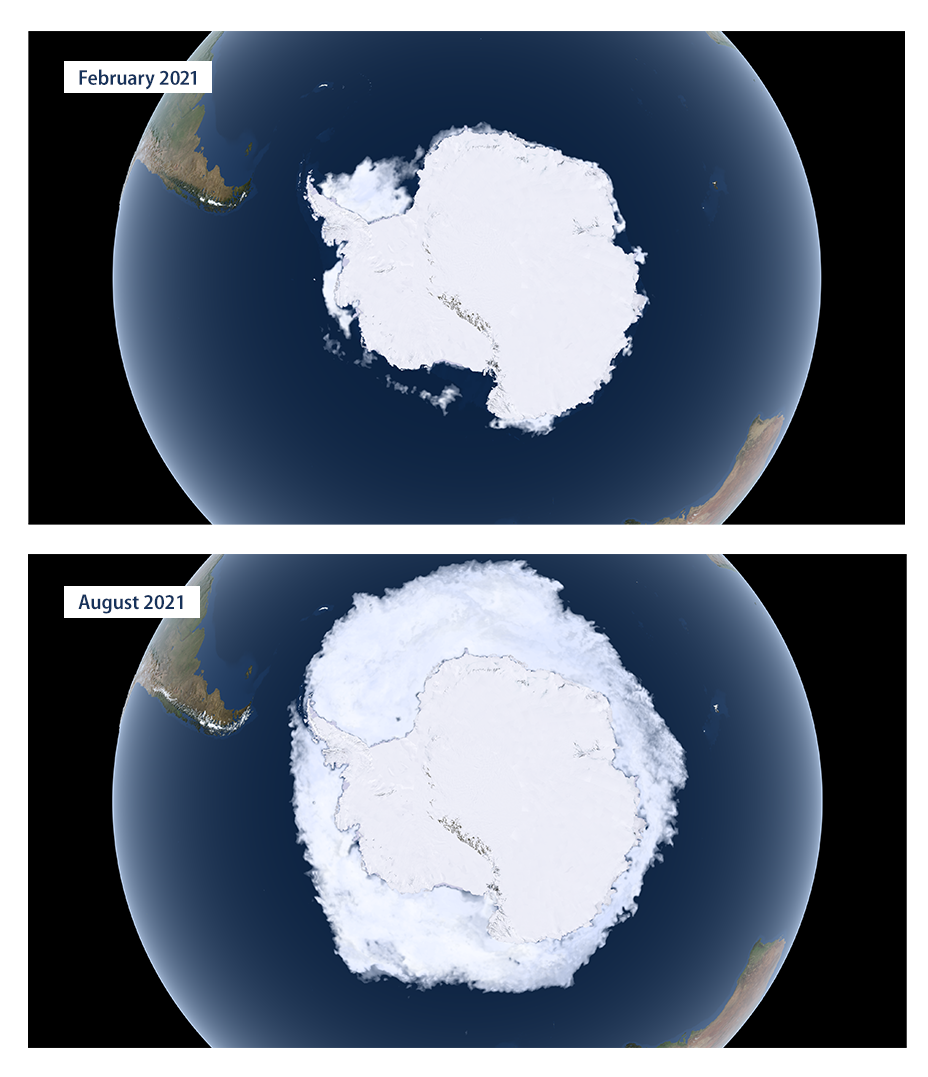
Source: NASA, 2022
These 2021 maps show how Antarctic sea ice coverage typically varies between annual minimums and maximums.
Key points
- Antarctic sea ice extent in September and February has increased slightly for most of the period shown in Figure 1 but has decreased in the last few years.
The previous measurements for September and February were mainly below average (see Figure 1). - The September maximum range reached a record low in 1986 and a high in 2014, although 2017 and 2018 were among the lowest years on record.
The February minimum range reached a record low in 2017, although 2013, 2014, and 2015 were three of the six most many years on record (see Figure 1). - The observed changes in Antarctic sea ice are small compared to the amount of sea ice the Arctic has lost over the same period.
Globally, the Earth lost sea ice at an average rate of 13,500 square miles per year from 1979 to 2014—equivalent to losing an area larger than the state of Maryland each year—and EPA figures show that net loss has continued since then, the decrease affects the Earth’s energy balance.
Background
- The Southern Ocean around Antarctica freezes every year and forms sea ice. This sea ice usually reaches its maximum extent in September or early October, around the end of winter in the Southern Hemisphere.
At this point, the entire Antarctica continent is surrounded by a ring of sea ice. The ice melts in summer due to higher temperatures and extended sunlight. Unlike the Arctic, where a large area of sea ice persists year-round, the sea ice around Antarctica is thinner and almost entirely melts in a typical summer.
This occurs because no land is present to prevent the Antarctic sea ice from breaking up and drifting north into warmer waters, where it eventually melts.
- Like Arctic sea ice, Antarctic sea ice affects global climate, regional climate, and ecosystems. Because ice is more reflective than liquid water, it plays a vital role in maintaining the Earth’s energy balance and helps keep the polar regions cool.
Sea ice also keeps the air cool by creating a barrier between the cold air above and the warmer water below. Antarctic sea ice is an essential part of the environment for penguins, seals, and other animals.
- Warmer air and ocean temperatures are expected to reduce the sea ice present worldwide.
While warming has already caused a noticeable loss of sea ice in the Arctic, the extent of Antarctica as a whole has not yet decreased, which may reflect the continent-wide effects of wind, ocean currents, and precipitation.
About the Indicator
- Figure 1 shows the extent of sea ice in Antarctica from 1979, when routine satellite monitoring began, to 2021. Sea ice extent is defined as the area of the ocean where at least 15 percent of the surface is frozen.
The researchers chose this threshold because it best approximated the ice edge. Data is collected throughout the year, but for comparison, this indicator focuses on the months when sea ice typically reaches its minimum and maximum extent.
February generally is when sea ice extent comes to its annual minimum after melting during the spring and summer. Ice usually goes to its full extent in late September or early October after a winter freeze, with the most considerable monthly average extent occurring in September. However, in 2021, the maximum range occurred in August.
- Unlike the EPA’s Arctic Sea Ice indicator, this indicator does not show the age of Antarctic sea ice. This is because almost all Antarctic ice melts each summer, unlike the Arctic, where much of the ice survives for several years.
About the Data
Indicator Notes
Compared to the noticeable decline in Arctic sea ice extent, the increase in Antarctic sea ice is negligible. Many factors appear to affect the degree of Antarctic sea ice, including changes in wind patterns and freshwater entering the ocean from melting ice sheets.
For example, a 2016 study showed that changes in atmospheric circulation patterns in the Antarctic region are responsible for the recent increase in the extent of sea ice.
Without better estimates of ice thickness and volume, it is difficult to characterize how the total amount of Antarctic sea ice is responding to climate change.
Data Sources
The National Snow and Ice Data Center provided the data for this indicator, which produces various reports analyzing sea ice.

Weather 01852 - Lowell MA

65°
clear sky
Feels like 64°05:31/19:51
72°F
/58°F
54%
1005 hPa
7 mi
11.5 mph


