Air pressure

Air density and pressure

Air density is its amount per unit volume in g/cm3 or kg/m3. Air density depends on temperature, humidity, and barometric pressure. The physical laws of boiling gases confirm this dependence – Mariot, Gay-Luisa, and Klaperon’s basic gas equation with the following brief content:

  • The higher the air temperature, the higher the temperature and its density are because as the temperature of the air increases, all matter expands, and the mass per unit volume decreases.
  • The higher the humidity of the air, the lower its density because the molecular weight of water vapor is only 0.622 of the molecular weight of air.
  • The greater the pressure, the greater the density because in the same volume of gas, all gases are compressed more at increased anxiety, and at a decrease in anxiety, they expand rapidly. The density of dry air, denoted under normal conditions ρ, is related to barometric Po, and temperature T is as follows:


where R is the constant of dry air, equal to 2.87 x 10³ Jun/Kg.°C
           – barometric pressure k sea ​​level,  – Air temperature (°K)
Humid air (contains water vapor) then :


(e in the SI system is calculated as N/m³).

The air density above the earth’s surface ranges from 1,175 – 1,200 kg/m³ for the equatorial region and from 1,500 to 1,600 kg/m³ for the middle and high latitudes, where the air temperature is very low.

Air pressure is one of the essential characteristics of atmospheric pressure. It is measured by the weight of a vertical column of gas per unit of horizontal surface – The air pressure distribution over the earth’s surface is uneven.

Because as we know, the mass of a column of gas depends on its density depends on latitude.

The higher the altitude, the lower the air density drops, which drops very quickly compared to temperature and humidity. So, pressure decreases with height.

The change in barometric pressure with height under mass balance conditions, i.e. the air is at rest. The following basic static equation characterizes this dependence.
∆p = – ρg ∆ Z or 
Inside: ρ – air density g/cm³.
            g – gravitational acceleration depending on latitude and altitude; at the equator, g is the smallest, and at the pole, it is the largest, at a play of 45° above sea level g = 980,616cm/s²
          pressure change p in a unit volume (cm³) of air with height Z and cross-section of 1cm², sign ” – ” to the right of the equation representing barometric pressure decreases inversely with the increase in altitude (see figure 1).

Figure 1. Variation of barometric pressure with altitude


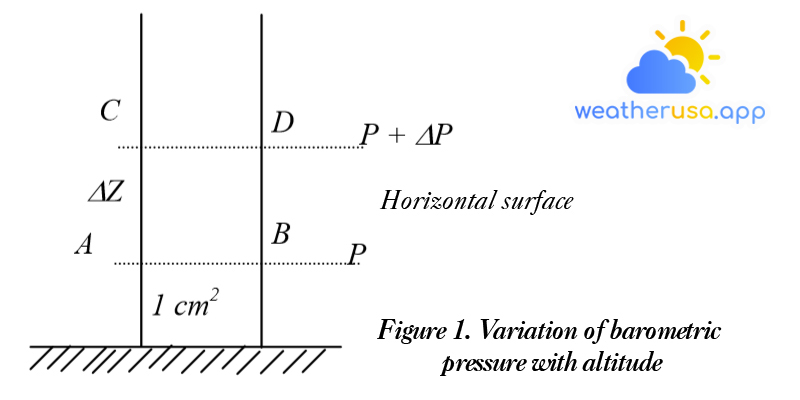
Figure 1 is derived from the basic static formula, and if the pressure P is measured on the surface AB, then at the surface CD, it is 1 cm higher than AB, an amount, ∆P reduces the pressure; dimensional level P =g/cm³ x cm/s²x cm³ = g x cm/s² = 1 din.

Barometric units of measurement.

In the international measurement system, the barometric unit is called Paskan – gas pressure 1N evenly distributed in the horizontal team of 1m² (N/m²).

In practical meteorology, the millimeter-bar and millimeters of mercury are used as the unit of measurement of air pressure.

 (because 1 N = 10⁵ din )


(In which 13,596 density of mercury at 0°C, 980,616 acceleration above gravity at sea level latitude 45°).

– At normal pressure – barometric pressure above sea level, at 45° latitude, temperature 0°C, the height of the mercury column is 76 cm.
P normal= 76 x 13.596 x 980,616 = 1013.25 mb 

– Standard barometric pressure is 1000 mb or 750 mm Hg in practice.

Converts atmospheric pressure to sea level. To compare barometric values ​​measured at weather stations at different heights simultaneously, they must be transferred to the same size. Pine Barometric pressure is usually transferred to sea level.
Po = P + ∆P
Inside: Po – barometric pressure at sea level.
           P- Barometric pressure measured at a weather station at a certain altitude.

          ∆P – Correction of barometric pressure according to altitude.

P barometric pressure correction depends on altitude. The higher the measurement of the meteorological station, the lower the barometric pressure and the more significant the difference between the measured barometric pressure and the pressure converted to sea level. In practice, the barometric correction is approximated by the following formula.


Inside Z: The altitude of the meteorological station is calculated as m
still     n: Called the barometric order.

For a low altitude near the sea, n = 10 m/mb. For every 10 m of ascent, the pressure decreases by 1 mb. Due to the sharp decrease in barometric pressure with height, the height is almost 5 km, the barometric order is nearly 15 m/mb, and at 18 km, it is 70 m/mb.

Methods and instruments for measuring barometric pressure

At stationary weather stations, most barometric pressure is measured by mercury barometers.

The design principle of the mercury manometer is based on balancing the weight of the column of gas placed on the mercury tube with the importance of the column of mercury placed in the box.

I am asking for high accuracy, or for some other reason, the ship’s station may use a box barometer.

Box-typemanometer. The main instrument for measuring barometric pressure on ships is a box manometer: type M-49-2.

The sensitive part of this device is a thin metal canister from which air has been released.The compression and expansion of the box are transmitted using a lever system to the index hands.

The scale of the box manometer is divided into millimeters of mercury. In a box fitted with an arc mercury thermometer, the manometer is placed in a protective wooden crate so that it is always in a horizontal position.

Figure 2. Box type manometer

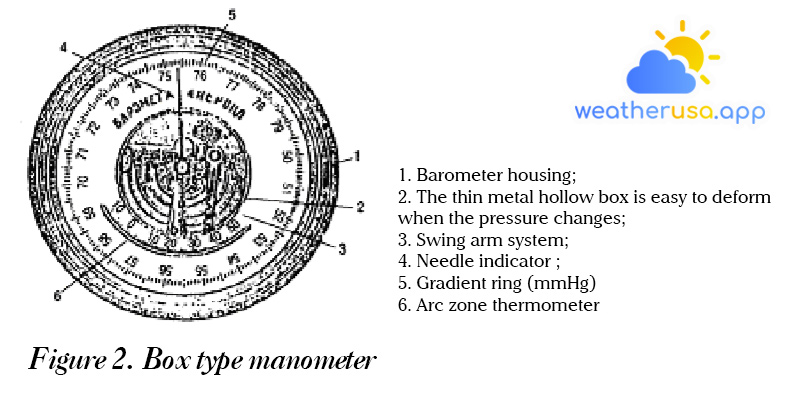
Although the reliability is lower than that of the mercury manometer, the box barometer has the advantages of robustness and portability, which is particularly advantageous for marine use and survey work.

The disadvantage is that the faulty part of the device is unstable, so it must be checked regularly.

When monitoring the barometric pressure, do not lift the box manometer from the protective box; read the thermometer reading precisely at 0°1, and keep your eyes on the needle when reading.The readings on the box manometer should be corrected according to the instrument certificate.

Normally, barometric pressure is used to determine the pressure at a place, such as on a ship, on a low island, or at a height where the approximate mean sea level can be seen from a box barometer, like sea level pressure and is not corrected for temperature or gravity.

When the gauge records itself.

Observing changes in barometric pressure over time is particularly important for the navigator because it predicts changes in the weather. A barometer is used for this purpose, automatically recording continuous barometric pressure changes.

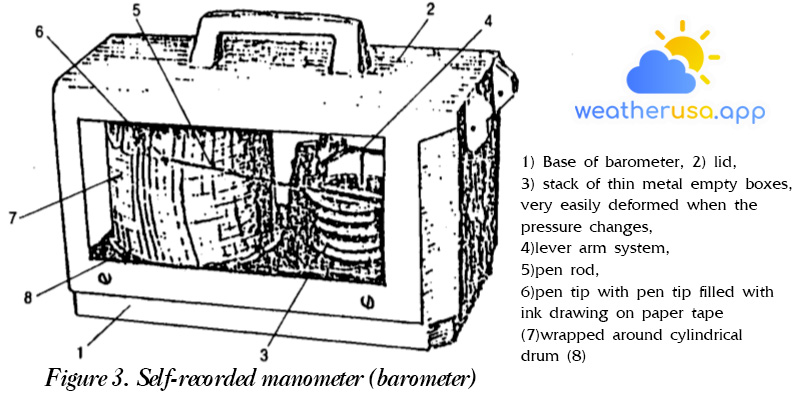
The structure of the pressure tag consists of two main parts: the sensing part and the recording part. The first is a stack of thin metal hollow boxes joined together in the shape of a spring. Compression and expansion of the pile of boxes by the action of variable barometric pressure through a system of connecting rods to the pen pole.

The nib is filled with a special ink applied to a tape wrapped around a cylindrical drum with mechanical action. Compression and expansion of the stack of boxes by variable barometric pressure through a system of connecting rods to the pen pole.

The nib is filled with a special ink applied to a tape wrapped around a cylindrical drum with mechanical action. Compression and expansion of the stack of boxes by variable barometric pressure through a system of connecting rods to the pen pole. The nib is filled with a special ink applied to a tape wrapped around a cylindrical drum with mechanical action.

Cylindrical drums are usually rotated daily and weekly. Correspondingly, paper tapes are also produced in two types, daily and weekly. The horizontal lines are the barometric pressure scale, which is the same for both types of bands.

The most comfortable onboard ships are used every week. According to barometers, the most important feature for predicting upcoming weather changes has been identified – such as barometric trends, which show how the air pressure will change, especially during the last 3 hours.

According to the curve on the paper, we can see how the barometric pressure changed in 3 hours and the characteristics of these changes.

Figure 3. Self-recorded manometer (barometer)


Daily and annual change in barometric pressure

Daily change in barometric pressure. These are fluctuations in barometric pressure with a day-night cycle, and they keep repeating for long periods.

According to statistics, there are always two maxima and two minima of local time in the daily barometric variations in the middle latitudes and the tropics.

The amplitude of the daily variation is more noticeable; see Figure 4.

Figure 4. Diurnal variation of barometric pressure over different latitudes
The amplitude of the oscillation increases with decreasing latitude. At 60°N space, the barometric difference between 10g and 16g is usually only 0.3 mb in Odecxa 0.8 mb, at 33°N – 1.8 mb, near the equator 3.2 mb.

At mid-and high latitudes, diurnal variations in barometric pressure are tiny, often masked by large pressure variations tens of times due to the occurrence of eddies vortex forward and backward.

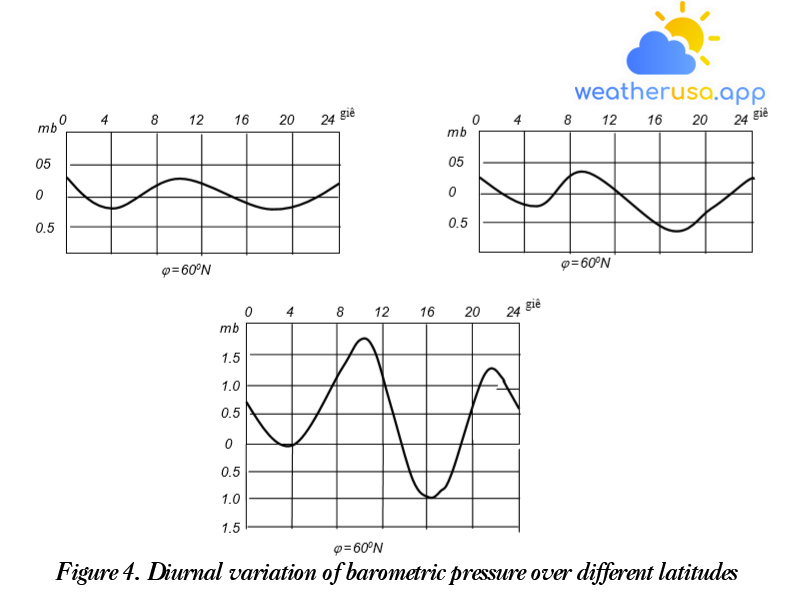
Depending on how active the eddies are in one area or the other, daily barometric pressure changes average between 3-10mb.

Annual variation of barometric pressure. On continents and oceans, barometric pressure processes are different and opposite. This is related to the extra heat capacities of water and soil.

On the mainland, it warms but cools quickly, and on the ocean, it warms slowly and cools slowly. The phenomenon is most noticeable in middle latitudes, where the intensity of the arrival of solar heat between summer and winter is different, so on the continents, the land and the air above it often heat up sharply in the summer, observing the slightest pressure, and in the winter, when the cold air decreases sharply in density reached a maximum, barometric pressure – max.

The annual variation of barometric pressure over the continent is substantial because in Siberia, the average amount exceeds 3mb, and in other areas, about 10-15mb.

Over the oceans, the lowest pressure occurs in December and January and the highest in July–August, but the annual barometric fluctuations are more down than over land. The average yearly amplitudes in moderate latitudes are 5-6mb, and in the tropics, no more than 2-3mb.

Barometric field at the surface of the ocean

Pressure systems. Barometric pressure is a variable quantity: at a given point, it constantly changes daily, monthly, and annually.

The field needs to be analyzed barometric to elucidate the characteristics of the barometric distribution at a certain point in time or over some time. Isometric lines are drawn on maps where observation data are recorded – a curve connecting similar barometric values. Isobars are marked with a spacing of 5 or 4mb or 1008, 1004, 1000, 996.

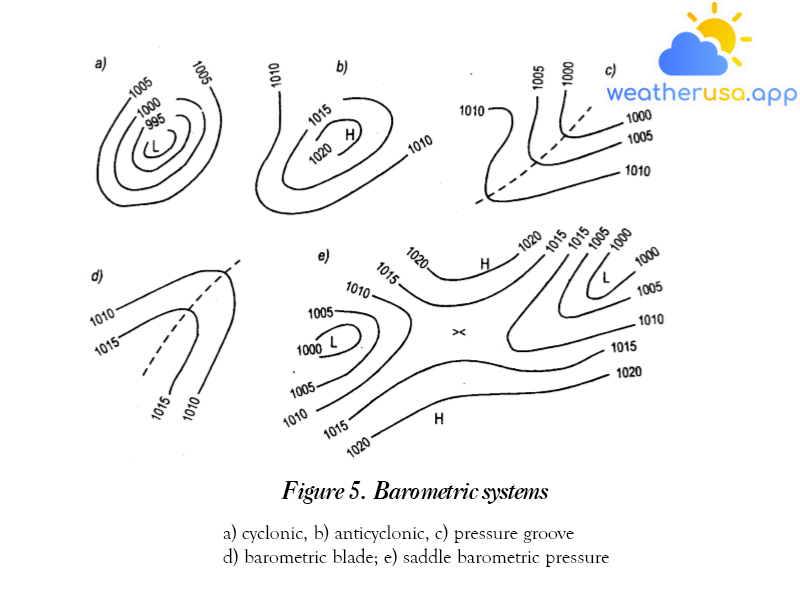
According to isobars, barometric fields are discovered. Its shape is named for barometric systems.

A barometric system is a sizeable proportional area in a barometric field with a typical barometric distribution. Pressure systems are divided into high-pressure areas and low-pressure zones with closed or non-closed pressure pipes.

A Barometric system with closed isobars – is cyclonic or anticyclonic.

Vortex – is an area of ​​low-pressure atmospheric disturbance, represented by a system of concentric closed isobaric lines, with the value of each isopressure gradually decreasing outwards toward the center with winds swirling around the center, counterclockwise in the Northern Hemisphere and clockwise in the Southern Hemisphere.

In the center, the pressure is lowest, and the width of the cyclone in the middle latitudes is usually from 1000 km in the early stage to several thousand km at the time of maximum development. In the cyclone’s center, the letter L English typically means low.

An anticyclone is an area of ​​high-pressure atmospheric disturbance represented by a closed system of isobaric lines whose values ​​increase from the outside to the center where the barometric pressure is maximum, with air swirling around the center clockwise in the Northern Hemisphere and counterclockwise in the Southern Hemisphere.

The width of the pressure high can reach several thousand kilometers in the center of the pressure height. Fill in the letter H, which is the first letter high.

Barometric systems with open isobaric lines – barometric grooves, barometric vanes, barometric pressures horse saddle.

Barometric trench – is an extension of isobaric lines from the cyclonic region. Sometimes a tiny low-pressure center with two or three closed isobars appears in the barometric trough. This center is called the local vortex.

Barometric sheet – is an area of ​​pressure altitude expansion. It has a high-pressure center with closed isobars called the back vortex branch.

The saddle barometric is an area in the barometric field located between two cyclones and anticyclones with a diagonally symmetrical distribution of saddle barometric pressure.

Figure 5. Barometric systems

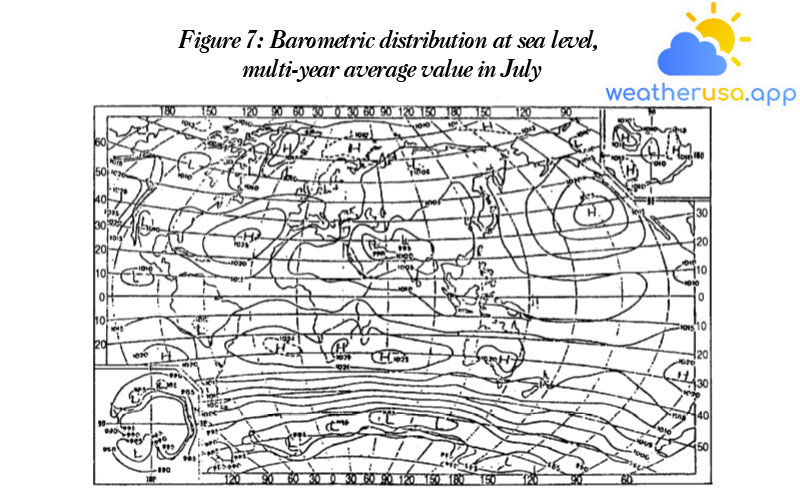
Distribution of atmospheric pressure on the earth’s surface. To clarify the characteristics of the distribution of barometric pressure over land and the ocean in different latitude zones in individual seasons, the average month of the year is mapped atmospheric pressure at sea.

The essential data used to create these maps are average barometric pressure values ​​calculated over a long series of years at many global observation points.

Consider such maps of the barometric field for January.
Comparing this map with another map, it is clear that in January and July, there is always a band of low pressure near the equator with a value of almost 1010 mb. It is called the equatorial belt of low pressure.

From the equatorial belt of low pressure going north and south to 20° – 40° north and south latitude, a belt of high pressure extends, branching off into separate areas of higher pressure – they are called subtropical high-pressure belts. Each area of ​​higher pressure in the center of this belt is named after its location: the Adop High in the North Atlantic and the Hawaiian High in the North Pacific.

Summer of the subtropical high-pressure belt in the northern hemisphere is interrupted in Arabia and India. Here, from intense warming, an expanding low-pressure area emerges.

But in the winter, on the same sites, anti-cyclone Xi Bia flooded. In the Southern Hemisphere, the subtropical high-pressure belt is branched into three independent anticyclones, the South Atlantic, the Southern Indian Ocean, and the South Pacific.

Figure 6: Barometric distribution at sea level, the multi-year average value in January

Figure 7: Barometric distribution at sea level, multi-year average value in July

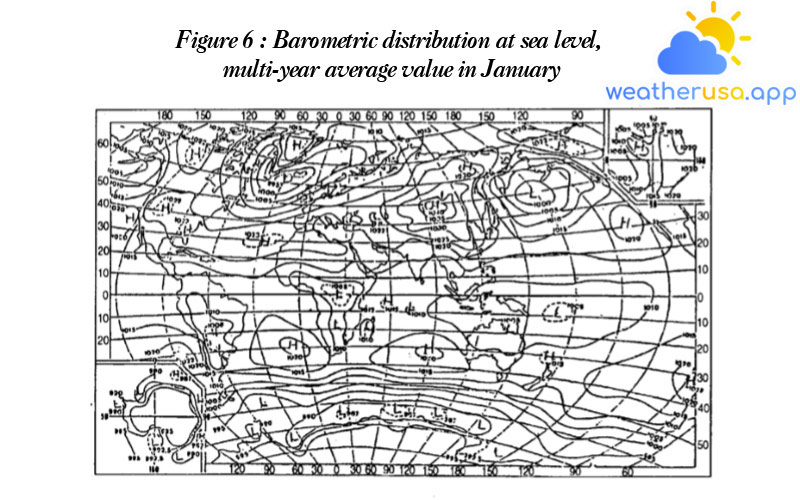
At mid-latitudes and near the poles, the pressure drops again, averaging around latitudes: in the northern hemisphere – to 1012, 1013 mb, in the southern hemisphere, at margins 60°- 70° south – 980 -985 mb.

In addition, at these latitudes the pressure distribution is relatively uniform. In the Northern Hemisphere, the average pressure along latitudes 1010-1012 mb, due to the uneven distribution of land and sea, forms many high and low-pressure areas, especially in winter.

Winter in the northern mid-latitudes has the following characteristic regions.
– Islan minimum – an extension that occupies the entire north Atlantic Ocean and extends to the Barenx and the Kar Sea pressure at the center of the zone; this area in Islan is ~995 mb.

– Cyclone Xi Bia – an area of ​​high pressure so enormous that it occupies Asia; The barometric pressure here in Mongolia is close to 1040 mb.

– Canadian Super Typhoon, more precisely a North American Super Typhoon, due to having two centers, one in northern Canada and one in North America, with a pressure of ≈1022 mb.- Cyclone Aleut – sweeps the entire north Pacific to the Bering Gulf; the pressure at the center of the Aleutian islands is about 1000mb.

For the southeastern hemisphere (July), the typical anticyclonic of Australia and South Africa (gas size 1020 and 1025mb, respectively).

Summer on the continents heats up, and alternating low-pressure regions replaces high-pressure areas. Islan’s minimum is preserved, but the area decreases sharply, and the barometric pressure at its center increases to 1010 mb.

Hurricane Aleut moves to northern Canada. Over the oceans, the Adop and Hawaiian cyclones extend northward, over the Barenxo Sea and north of the Bering Gulf appear in areas of higher pressure. In the polar regions, there are high-pressure centers that exist all year round, especially in the Antarctic high-pressure area.

The climate zones of permanent high pressure and low pressure listed above are called the center of climate action of the atmosphere because they are pressure zones that determine the general circulation of the atmosphere, climate, and weather over the atmosphere’s vast territories of the globe.

Weather 01852 - Lowell MA

clear sky

58°

clear sky

Feels like 57°
Sunrise/Sunset - 01852
Sunrise/Sunset

05:36/19:47

Temperature - 01852
High/Low

62°F

/

52°F

Humidity in 01852
Humidity

65%

Pressure
Pressure

1021 hPa

Visibility
Visibility

7 mi

Wind
Wind

6.91 mph