Meteorological and Weather Forecasting - P2
Storm forecasting service
- Of great significance to the safety of navigation are warnings about dangerous phenomena, which are transmitted by the national meteorological services.
- In many countries with territorial waters, regular forecasts of the state of the sea surface and storm forecasts are made during the warm season.
Meteorological, hydrographic, and sea surface conditions, including fleets of navy, ships, transport, and fishing boats… are concerned with wind, waves, visibility, sea level change, fog…
- National hydro-meteorological forecasting centers of countries often issue storm warnings according to their own conventions, however, their main content often has the following main ideas.
– Forecast type: tropical cyclone, an extratropical cyclone
– Time and date of publication according to international time;
– Atmospheric disturbance pattern, with central barometric pressure (mb);
– Location of disturbance center (longitude, latitude);
– Movement direction and speed
– The danger zone and its size;
– Wind speed and direction at the various fan blades in the danger zone.
– Anticipate the possibility of disruptions in the future.Storm warnings are transmitted in the local language (and possibly English).
As for the format of the storm announcement that can be in different languages, here is an example:
a- About tropical cyclones: Table 13 a
| Vietnamese | English | Wind | |
| Wind power (level)
|
Speed (bow) | ||
| Tin áp thấp nhiệt đới | Warning
|
<7 | <33 |
| Tin bão thường
|
Gale warning | 8-9 | 34-47 |
| Tin bão mạnh
|
Storm warning
|
10 and older | 48 and older |
| Tin bão cực mạnh | Hurricane (or proper noun, e.g. typhoon)
|
12 or more
|
or greater
|
b. About extratropical cyclones: table 13-b
| English
|
Vietnamese | Wind (level) |
| Near gale warning
|
low-pressure news | 7
|
| Gale warning
|
regular storm news
|
8-9
|
| Storm warning
|
strong storm news
|
10 and older
|
| Warning of tropical cyclones
|
The storm is very strong
|
above level 12 |
Storm warning, at 0000 4 august, a deep low central pressure 980milibars, was located at 45 north 27 west, moving north-east 30 knots, affecting an area extending 400 miles the center, with long moderate swell from in NW and SW quadrants and medium moderame swell from S to SW in SE quadrant and confused sea in NE quadrant.
Wind NW force 8 in SW quadrant, NW to force 9 in NW quadrant, SW to S force 9 in SE quadrant, and SE to S force 9 inner quadrant, increasing to force 10 to 11 for a distance of 200 miles from the center in this last quadrant.
This storm center is expected to slow down and turn northward with little decrease in the wind during the.
Facsimile weather map
Facsimile map? Its characteristics.
- With the purpose of improving the efficiency of weather services for maritime, aviation, and instant messaging to ships, today many types of weather maps, sea surface maps, and bulletins are widely used. other meteorology using family radio equipment.
This device is a wireless device that can transmit or receive black-and-white photographs, maps, and graphs of written or digital materials. At weather forecasting centers, or at service facilities onshore, people use facsimile machines to broadcast meteorological information for different areas on certain frequencies, at certain times.
Thanks to the electrochemical paper of the facsimile receiver, it is possible to receive the transmitted information in its original form. - The facsimile weather map gives the captain an overview of weather conditions and conditions sea level, over a large area.
- The facsimile map differs from normal weather maps in that: the paper size is smaller, and the data on it is less, but larger and clearer.
The content of the facsimile weather map cannot fully state all meteorological factors, but only prominently and easily reflects a number of factors that the conductor needs. - Most facsimile maps contain information about the current weather state – called analytical maps, denoted by the letter A – Analys; or future weather – forecast map, symbol F . Forecast, (see Figure 1).
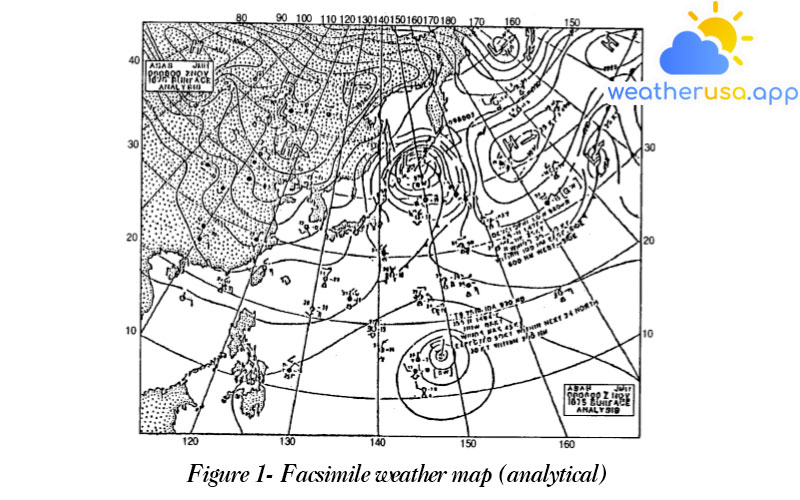
In some weather maps (analytical) the direction is indicated by arrows, indicating the movement of cyclones and anticyclones, sometimes also citing source data about the weather on stations.
On the weather map (forecast) predicts dangerous weather events for the next 12 24, and 48…hours. Such insights, recorded in the form of words or conventional signs, are extremely important to the navigator.
How to assess weather states on facsimile maps
So pay close attention to the map (analysis and prediction) of the velocity of the cyclones, the anticyclone of the trench and the barometric tongue, of the fronts, and their evolution over time.
- Determining wind direction and speed on maps with wind data is not difficult at all. On maps, where wind data are not available, the direction and speed of the wind are determined by isometric lines.
The direction of the wind is found, by calculating its inclination relative to the isobaric, towards the pressure drop by an angle of about 30° on land and about 15° at sea. When the wind speed is high above 20 m/s, the inclination of the wind direction relative to the pressure is smaller (5-10°) than when the wind speed is small.
Wind speed can be determined using a gradient ruler: according to the distance between the isobars, one determines the geospatial wind speed, then to convert to the real wind speed, it is necessary to correct it according to the dependence of the temperature difference water and air.
Remember: the larger the barometric gradient, the greater the wind speed, ie the smaller the distance between the isobars, the stronger the wind. In the case of the same barometric gradient, i.e. equal spacing of isobars, the greater wind speed is in lower latitudes (tropics), than in high latitudes (near the poles).
At the same value of barometric gradient, the wind speed gradient in the cyclone is smaller than the tropical wind, and in the anticyclone – larger. - Wind speed is also influenced by the day-temperature variation. Indeed, during the day when the subsurface and lower air layer are heated intensely, the wind speed increases dramatically, in many cases reaching the wind speed gradient.
In the thick low cloud weather of cyclones, the wind’s diurnal course is more obvious than at sea; because the diurnal variation of temperature on land is greater than at sea.
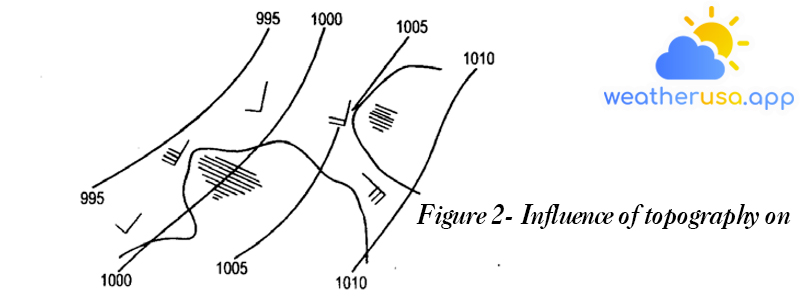
- Local topographical features also greatly influence the change in wind direction and speed. For example: in a uniform airflow from the sea to the mainland, after meeting the coast, it is deflected to the left and weakens, and if it is blowing from the land to the sea, it deviates to the right and becomes stronger.
The wind blowing along the coast, in the nearshore region, is always stronger if the land is to the right of the wind direction, and weaker, if to the left.

- The shore effect, which strengthens or weakens the wind strength, is particularly evident where the wind blows around a branch of a mountain range or where the land juts out into the sea.
The resulting circumferential flow forces the air currents to be compressed, leading to an increase in winds at the top of mountains, capes, and peninsulas, and a decrease in bays.
Wind speeds are stronger in the straits and at the constrictions, plus the predominant direction is blowing along the direction of the barometric gradient (figure 2).
It should then be remembered that a change in vision depends on the passage and state of the airship.
As a rule: the area of high winds and storm winds (large barometric gradient) will be where the waves are large. Furthermore, the wave intensifies as the duration and distance of the wind prolong.
In the sea at the end of the wind, the waves are much larger than in the upwind area. Strong and prolonged waves are observed in the latter part of the deep and wide cyclone. Wave strength near shore is, to a considerable extent, dependent on local conditions. However, the largest waves (when the wind is blowing strong from the shore) is often observed over a distance when away from the coast.
When the wind blows from the sea to the shore, it should be remembered that, due to the rapid decrease in the depth of the sea, the wave speed increases sharply and the waves change their direction of propagation, creating waves crashing against the shore.
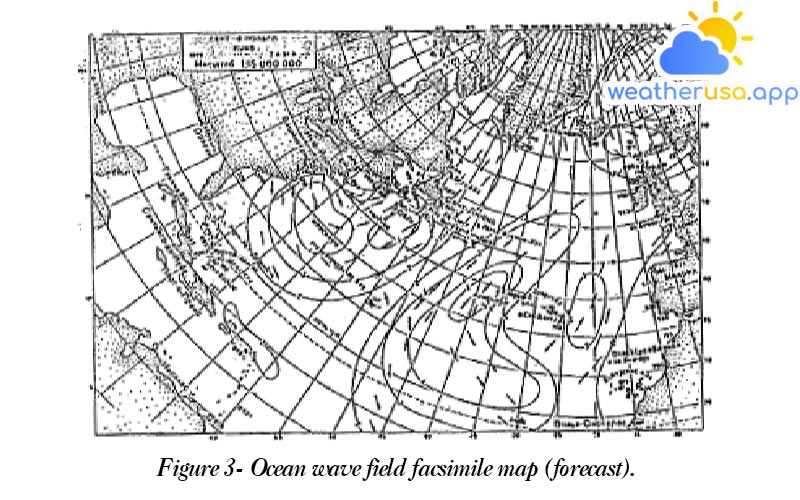
e. Wavefield facsimile map (Fig 3). Maritime practice shows that the waves, not the wind, have the strongest influence on the speed and safety of ships at sea and on the ocean. Indeed, there are many types of ships when the wave is 5-7 m high, the speed loss is 50%.
From this, we see that, for the conductor, it is necessary to know what wave heights will occur on the ship’s journey. That information will be obtained from the marine habitat facsimile map (fig. 3) which shows the live altitude numbers (in meters or futs), the direction of wave propagation (with arrows), the wave period as seconds and other factors, or the wave field – these are wave isometric lines with symbols for regions with maximum and minimum wave values. On the map, it is possible to refer to the numerical data and the contour lines at the same time.
In addition to the current wave map, a wave forecast map for the next 12, 24, and 36 hours is also transmitted.
Local weather signs
General concept
- Local signs of weather are various signs and phenomena observed in a given area, whereby weather conditions can be foreseen in the near future.
These include cloud characteristics, visibility, optical phenomena, and barometric and wind variations… - In the assessment of the current and future hydro-meteorological situation, it is necessary to use the data transmitted from the weather forecasting facilities, of different countries.
At the same time, it is necessary to pay attention to the weather characteristics in the area where the ship is operating, because it is not always possible for forecast maps and weather bulletins to account for all changes occurring in the atmosphere book.
Reality shows that weather forecasts are not always completely correct. Just a slight error in the direction of a cyclone can have disastrous consequences for ships.
On the other hand, in the oceans and seas, there are often very few meteorological and hydrological stations arranged, so they often miss small-scale weather phenomena, such as tornadoes, and fog, which will lead to damage. or difficulties for ships operating in that area. - Therefore, it is necessary to conduct direct and regular observations on board the ship about weather conditions and changes, which will help in editing weather maps, and accurately assessing the upcoming characteristics of the weather, thereby selecting the right weather conditions choose the safest and best route for the ship.
Local signs of future weather
Then compare those observations, with changes in barometric and wind pressure, and with other meteorological factors and phenomena. It is useful to monitor optical phenomena as well.
– Temperature changes little throughout the day, but its diurnal variation exists; Fog at night and early morning on deck equipment and on the superstructure of the ship aquatic,
– The sunsets, behind the clear horizon (no clouds, high pressure);
– Distortion of the sun at sunrise and sunset over the sea
b. Stable weather conservation sign. Stable weather represents little clouds or changeable clouds; in the given area (but not necessarily the area with ships) showers in some places; weak to moderate winds; visibility over two nautical miles.
– Cumulus clouds develop with thick cumulus domes (the daytime atmosphere is heated; high-pressure area – usually in the western part of the saddle barometric pressure);
– The wind is weak or moderate, with short bursts of strength;
– the pressure remains almost constant for several hours;
– Dew at night and morning;
c. Bad weather conservation sign. It was overcast, and cloudy, with moderate to strong winds; lower vision two nautical miles.
– The sky is cloudy, unchanged (cucumulus clouds, thick cumulus clouds)- this is the center of the sky a little moving vortex.
– The barometric pressure is lower than the surrounding background, or there is a slight decrease in the barometric pressure, no day changes are seen
– Temperature has no date variation.
– Strong moderate wind; Wind direction changes slightly.
2. Signs of worsening weather.
a. The weather deteriorated with phenomena characterized by hot ftons or obtuse fronts; moderate precipitation, wind increasing, visibility less than two knots:
or cirrus, spreading cirrus clouds gradually filling the sky and thickening, the possibility of a halo appearance (approaching of the cyclonic front or barometric trough, together with a warm front 100-300 km before moderate precipitation) );
or cirrus clouds change to grayish mid-level clouds; halo loss (approach of the hot front, impending moderate precipitation); or a transition from a meso-grey layer to a cloud-climate with precipitation (the approach of the cyclonic center or of the trough axis is associated with a hot front or an obtuse front, precipitation can last for more than 10 years);
or the appearance of cumulus clouds – stratum, under which there are often thin cumulus clouds of bad weather, accompanied by precipitation (the passage of the cold front, the central part of the cyclone, precipitation can last for more than 6 hours).
– Strong flickering star with a blue tint (high humidity and unstable air group stratification).
b. Bad weather with moderate winds, occasional frost, and fog can persist for several hours, then worsen due to the approach of the cold front.
– The waves don’t increase anymore.
c. Cloudy weather with phenomena characterized by cold fronts; Shower and moderate precipitation, moderate to strong winds, visibility below two knots. Presence of cirrus clouds, possibly with cirrus or cirrus clouds (the approach of the trough is related to the relative to cold front);
Ship services by recommendations to choose the optimal route
Meaning of choosing the optimal path
Today, thanks to the achievements of methods to predict weather and sea surface conditions, thanks to the results of marine and ocean climate studies, it is possible to choose in advance the safest and most economical route for each individual trip.
Accounting for recommended voyages is based on weather and wave forecasts along with taking into account the current complex weather conditions in the vessel’s navigation.
The purpose of the recommendations – is to help the captain reduce the burden of the threat of dangerous weather conditions such as storms, icebergs, and turbulent seas…and to some extent increase the economic efficiency of the ship trip (about 3-4%).
Unlike normal hydro-meteorological services, then the navigator collects general weather forecasts and sea surface conditions in the operating area, while in trip selection recommendations, the coordinates of the route are reported, thereby performing a diversion for the purpose of detouring from an area subject to adverse weather and sea surface conditions.
In addition, weather data is also available on the route of tropical cyclones and extratropical cyclones, large wave zones, ice edges, and icy seas…
Captain duty on the optimal route
In ship service, the weather center needs to receive from the captain a variety of strategic insights: the vessel’s name and form, its speed in still water, the expected upper limit of altitude waves, route and journey time, and tonnage of the ship.
Sometimes sailing on a pre-selected route, the ship needs to regularly report (2 times a day) to the forecast center, where recommendations, weather, and ocean conditions are made.

Weather 01852 - Lowell MA

61°
few clouds
Feels like 58°06:01/19:28
65°F
/53°F
44%
1018 hPa
7 mi
6.91 mph


