Meteorological and Weather Forecasting - P1
Organization and Structure of Meteorological Services
Global Meteorological Service and Its Implications for Maritime Traffic.
- Weather forecasting is only possible when insights into it come from large areas of the globe. Getting that information needs the cooperation of many countries around the world.
Thus, in 1873, the “International Meteorological Organization” was born. In 1951, that international organization changed to the “Global Meteorological Organization”, a special agency of the United Nations. In 1983 the organization had about 140 member countries. - The aim is to internationalize monitoring stations and coding meteorological information, to internationalize all weather impacts on shipping, aviation, agriculture, and all other human activities; support for research and training.
- To carry out its mandate, the WMO has a secretary general and a commander based in Geneva, under the direction of an administrative council of 24 directors, meeting annually, the General Assembly of the WMO.
WMO meets every 4 years. For ease of operation WMO divides the world into 6 regions, in each region meteorological activity is coordinated by regional cooperation.
The technical work is supported by eight WMO technical committees, consisting of experts from different countries. The Technical Council meets every four years and they work by exchanging documents between sessions.
WMO Maritime Meteorological Council, influential beginning in the spring of 1853 at the Brussels conference, was concerned with all aspects of maritime meteorology.
It is widely acknowledged that world meteorology is rooted in Maritime Meteorology, as weather directly affects the safety, convenience, and success of seafarers more than most other subjects another statue. - The oceans not only cover three-quarters of the earth’s surface but are also a major source of atmospheric disturbances and dramatic weather changes.
Therefore, meteorologists need regular observations from the oceans and seas, from places where there are islands, but can only receive observations from ships.
Of such importance that at the Brussels conference of 1853, ships from many different countries had to be selected and voluntarily conducted hydrological and meteorological observations on a regular basis. - The advent of radiotelegraphs not only made it possible for ships to send observations to shore, but also made it possible for weather forecasters to broadcast information to ships about sea surface conditions in different areas.
Today these announcements are very comprehensive and in some cases even include data to enable weather mapping on board ships. - In each WMO member country, there is a Central Meteorological Organization. Bureau of Meteorology, or General The Department of Meteorology and Hydrology is responsible for building hydro-meteorological stations and monitoring hydro-meteorological factors, establishing facilities for training full-time staff, and doing scientific research, weather forecast In the national forecasting facilities can perform general forecasts and specialized weather forecasts. Specialized forecasting serves specific industries such as agriculture, maritime, and aviation…
Sinov meteorological station network
- Globally, there are almost 100,000 weather observations per day, in the near-ground atmosphere, and about 11,000 – in weather conditions by class.
- Upper atmosphere. Those observations were made on nearly 8000 ground stations, 3000 transport, and specialized aircraft, and 4000 cargo ships.
There is also information from artificial satellites, meteorological rockets, and from various automated stations. - Forecasting offices must collect weather and sea surface information, from as many stations as possible.
Such observations are made on all stations at a unified time and these stations are known as Sinov Meteorological Stations on the ground. There are also observations, on radio probes, on balloons, so called high-zero stations. - Fixed monitoring stations on the mainland and on islands are recorded with 5 conventional numbers, of which the first 2 numbers are the area numbers on the distribution map of the stations, and the last 3 numbers are the ordinal numbers of the stations.
Observation stations on mobile ocean liner are marked with letters for themselves. These ships, when reporting their observations, need to indicate the coordinates of where they stand, such as earth octaves, longitude, and latitude.
Meteorological Information Coding
- Meteorological information as a result of Sinop stations’ observations, weather forecasts, storm forecasts, interpretation of weather conditions and sea surface conditions are only valid if they are transmitted over a short period of time shortest time period.
Therefore, for the sake of speed and convenience, meteorological information is encoded according to international conventions and distributed in a simple and uniform way around the world.
The encoding of meteorological information is often specified in the form of groups of numbers and conventional symbols, so it can remove all language barriers, making the circulation between countries easy, convenient and easy u understand. - To encode monitoring data and decode meteorological messages, WMO establishes different meteorological codes, which are used uniformly by all Member States.
- The codes commonly used to generate the Sinov codes according to the observations carried out on the shore station are FM – 12 X SYNOP, and for stations on ships, it is FM 13 _ x SHIP. The following is a shortened diagram of the two codes aabove law:
a. FM – 12 X SYNOP:
| AAXX | IIiii | Nddff | |||
| (0) | (1) | (2) | (3) | (4) | (5) |
| (6) | (7) | (8) | (9) | (10) | (11) |
Note:
AAXX – Indicates that the Sinov news is broadcast from the shore.
YY – date (in universal time) of the bulletin.
GG – observation time (in GMT); – method indicator and wind measurement unit (in code)
YY – date (in universal time) of the bulletin.
GG – observation time (in GMT);
II – Station’s domain number plate specified by WMO
iii – Station number plates are regulated by the National Meteorological Department
 – whether precipitation data is reported or not, if not, i = 3, otherwise i = 4
 – Operation indicator (manual or mechanical) and weather group indication
h – Cloud base height (in m)
iii – Station number plates are regulated by the National Meteorological Department
h – Cloud base height (in m)
VV – Horizontal visibility (in level);
N – Total amount of cloud (by grade);
dd- Wind direction (according to wind direction code)
 – sign of air temperature and temperature of dew point.
The numbers 1, 2, 3, 5, 6, 7, 8 precede groups of (5), (6), (7), (8), (9). (10) and (11) are group numbers unchanged.
N – Total amount of cloud (by grade);
dd- Wind direction (according to wind direction code)
The numbers 1, 2, 3, 5, 6, 7, 8 precede groups of (5), (6), (7), (8), (9). (10) and (11) are group numbers unchanged.
TTT – Air temperature (accurate to a tenth of a degree Celsius);
And PPPP – Barometric pressure is referred to as sea level (tenths of mb);
a. Characteristics of barometric trends over the past 3 hours. If: a = 2 – tendency of barometric pressure to increase (positive); a = 7 is decreasing (negative) and a = 4 is constant;
PPP – Barometric value change over the last 3 hours (to tenths of a mb)
RRR – Precipitation over the last 6 hours (according to a convention);
 – is the duration of the period for calculating the amount of precipitation,
ww – current weather characteristics (by code);
b. FM – 13 X SHIP
| BBXX | Nddff | ||||
| (0) | (1) | (2) | (3) | (4) | (5) |
| 4PPPP | 5 aPPP | 6RRR |
7wwWW | ||
| (6) | (7) | (8) | (9) | (10) | (11) |
| (12) | (13) | (14) | (15) | (16) | (17) |
Note :
BBXX – indicates a weather report from a ship. After this group is the symbol of the ship
The numbers 0, 1, 2, 3 … before each group are usually unchanged ;
222 – number plate unchanged
 – Main course of the train in the last 3 hours;
 – Average speed of the train over the last 3 hours ;
 – an indicator of signs and types of instruments for measuring surface seawater temperature (by code)
99 – Table of constant numbers;  – a quarter of the earth where ships operate
 and
and  : latitude and longitude (to tenths of a degree)
Example 1: Electricity code obtained from a shore station by groups of numbers :
15061 27025 42598 02008 10083 20058 30156
52145 60000 ///// 80000
Decryption
- Group number 1: YY – day of the month – 15
GG – observation time – 06: 00 GMT
- Group 2: II – Station number table – 27
iii : page number table – 025Group 3:: 4- Precipitation index – omitted.
: 2- manual or automatic station indicator of weather data – manual.
h:5- low cloud base – 600 – 1000m.
VV: 98- horizontal visibility – 20 km.
VV: 98- horizontal visibility – 20 km.
- Group 4: N : 0- general amount of clouds – no clouds.
d d : 20- wind direction – 200° .
ff : 08- wind speed – 8 m/s - Group 5: number 1- constant index
: 0 – sign of temperature – no sign.
TTT: 083- air temperature – 08°3C .
- Group 6:
: dew point temperature is 05°8C
- Group 7:
: station level pressure- 1015.6 mb
- Group 8: a. 2- Barometric trend – increased in the last 3 hours .
PPP – 145: Barometric trend to increase 14.5 mb
- Group 9: No. 6 : constant index 0000: Precipitation – no rain
- Group 10 : Number 7: Stats unchanged
ww: Current weather – skip (//)
- Group 11: Number 8: Stats unchanged
0000: Cloudless
Example 2: Electrical code obtained from a station on board a ship, by groups of numbers:
19061 99527 70355 42598 82408 10081 40264 22200
20302 326 // 41208
Decryption :
- Group 1: YY: 19th of the month
GG: Observation time 06: 00 GMT
- Group 2: 99: Indicators for broadcasting from ships
- Group 3:
- Group 4:
h: 5 – Low cloud base – 600-1000 m
VV: 98 – Horizontal Visibility – 20 km
- Group 5: N: the 8-General amount of cloud – cloudy sky
d d : 24 – Wind direction – 240°
ff: 08 – wind speed – 8 m/s
- Group 6: Number 1 – constant stats
TTT: 081 – air temperature – 8°1C
- Group 7: No. 4 – Stats unchanged
PPP: 0264 – barometric pressure at sea level – 1026.4 mb
- Group 8: 222: Index unchanged
- Group 9: No. 2 – Indicator number
: 03 – wave period – 3s
: 02 -wave height – 1m
- Group 10: No. 3 – indicator
: 26 – wave direction – 260°;
- Group 11: Number 4 – indicators
: 12 – for the great wave period – 12s,
: 8 – Great wave height – 4 m
c. In addition to the above two code codes, in meteorological and hydrological information, codes are also used international law such as:
-FM -14X: surface meteorological monitoring message from land mobile SYNOP MOBIL station.
– FM-15X METAR: regular airport weather reports (with or without trend forecast)
-FM 18X BUOY: monitoring information from buoy station
-FM -14X: surface meteorological monitoring message from land mobile SYNOP MOBIL station.
– FM-15X METAR: regular airport weather reports (with or without trend forecast)
-FM 18X BUOY: monitoring information from buoy station
Weather map
The concept of weather map:
A weather map or Sinov map is a geographical map on which, thanks to numbers and conventional symbols, the results of meteorological observations, or the results of high-level observations, are not recorded in a single location exact time.
Such weather maps allow the monitoring of weather conditions and atmospheric states over any selected area. When compared with each other, it is possible to evaluate the “Sinov processes” and weather changes over time. Knowing the law of change, can predict the weather in the future.
Such weather maps allow the monitoring of weather conditions and atmospheric states over any selected area. When compared with each other, it is possible to evaluate the “Sinov processes” and weather changes over time. Knowing the law of change, can predict the weather in the future.
Types of weather maps.
There are two types of weather maps: terrestrial weather maps and barometric topographic maps.
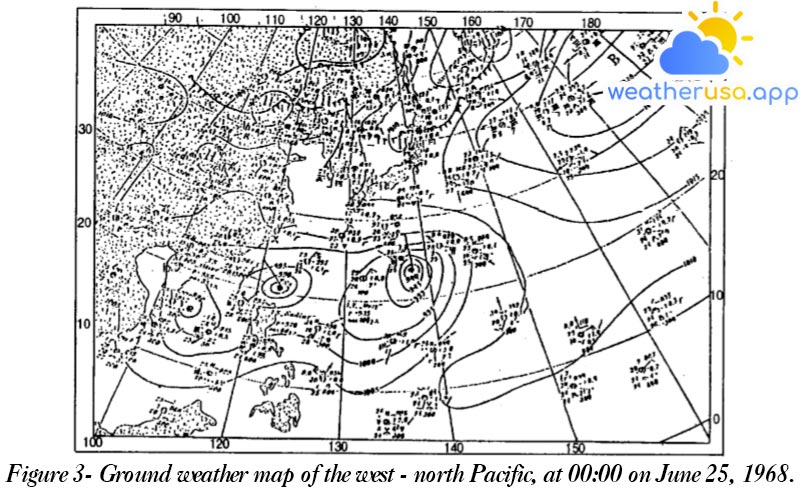
a. The ground weather map is established according to meteorological observation data, at the main observation times at 0 o’clock, 6 o’clock, 12 o’clock and 18 o’clock GMT.
Such observations, transmitted regularly by radio, from a network of fixed meteorological stations on land, on islands and from ships, are marked by groups of numbers , the common notation, belongs to the International Meteorological Code.
Such observations, transmitted regularly by radio, from a network of fixed meteorological stations on land, on islands and from ships, are marked by groups of numbers , the common notation, belongs to the International Meteorological Code.
At meteorological forecasting centers, they collect those observations, of all the stations in a given area, and record them on a printed geographical map.
b. Barometric topographic maps are established, based on data observed at different altitudes in the troposphere. These maps, contain weather information such as temperature, barometric pressure, humidity, wind… on the respective isostatic surfaces.
The most important barometric maps, established for the major isobaric planes, are: 850 millibars; 700 millibars ; 500 millibar 300 millibar. These are absolute maps, usually denoted AT.
How to map weather on the ground
After receiving and decoding the monitoring data of a certain period, people record them on a map.
The way to record data and conventional symbols for a meteorological station is done according to the following diagram (figure 1)
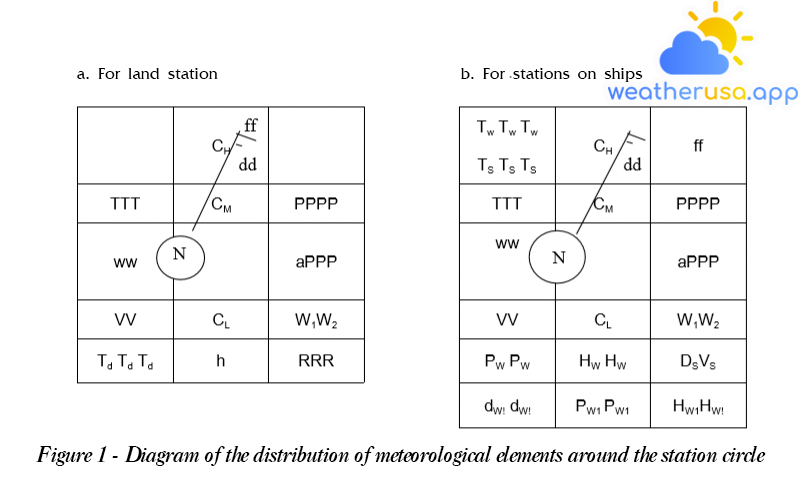
Note:
The symbols shown in the two diagrams above are mostly noted, but here they are filled with numbers or signs – For example: CH, CM, CL : the conventional notation of upper, middle and lower clouds; N – the degree of cloud fill in the station circle; wind direction – arrow indicates the direction of wind blowing to the station circle, wind speed – horizontal line at the end of wind direction, long horizontal line corresponds to wind speed of 5 m/s, short horizontal line corresponds to a speed of 2.5 m/s s, in the case of high wind speeds, triangles replace the horizontal lines.
In addition, for stations in the northern hemisphere, horizontal lines extend from the tail of the arrow to the left, and in the southern hemisphere – to the right. ww- current weather characteristics and W1W2 – past weather recorded by common signs ; h height of cloud base ; Ds, Vs: The direction and speed of the train are usually represented by arrows, with the arrowheads indicating the direction of the ship along with the speed.
In addition, for stations in the northern hemisphere, horizontal lines extend from the tail of the arrow to the left, and in the southern hemisphere – to the right. ww- current weather characteristics and W1W2 – past weather recorded by common signs ; h height of cloud base ; Ds, Vs: The direction and speed of the train are usually represented by arrows, with the arrowheads indicating the direction of the ship along with the speed.
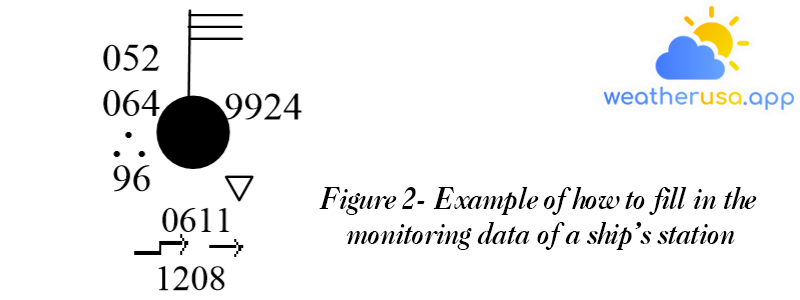
- For example, looking at figure 50 of the train station, looking at the symbols and numbers on the map we understand cloudy sky; north wind with a speed of 15m/s; sea temperature 5°2C, air temperature 6°4C, barometric pressure 992.4 MB, current weather: moderate rain, past weather: showers;
Visibility 99 ~ 2.2 nautical miles; ship direction: east (90°), speed
- Based on the ready-made data on the map, meteorologists make an analysis, draw isobaric lines such as isobaric lines, isotherms, and front lines, and then mark the positions of the centers. center of low pressure, high pressure … this work needs to be done very carefully because it is a very basic knowledge on which to make weather forecasts.
- This type of map is called an : analytical weather map, usually denoted by the letter A -I dot and the initials of the word Analyses, see Figure 3.

Weather forecast
What is the weather forecast?
It is an estimate, an estimate of the probability of future weather. It comes from the word forecast, first used in meteorology by Admiral Fitzroy around 1860 when he was trying to predict weather and storms.
Weather forecast format and content
The weather forecast format is divided by time, including the following main types: short-term forecast; medium term; long term.
Short-term and medium-term forecasts are further divided into general forecasts and specialized forecasts, i.e. with separate content.
The general weather forecast is intended to spread among people and national economic organizations the most common weather characteristics such as cloudiness, precipitation, wind, temperature, and special weather phenomena: storm, flood, and rising water…
Specialized weather forecasting includes weather characteristics required by specific industries. For example, for agriculture, it is necessary to report elements of precipitation, wind, temperature, and humidity, while for the marine industry: forecasts, wind direction, and speed, and wave factors…
All forecasts are made for each geographical area, each land area or area on the water, each part of the sea and ocean, and sometimes even for individual ports, for each route submit one.
The main principles of making weather forecasts
- The analysis of Sinova maps and barometric topographical maps ascertains the current state of the weather, which allows for solving the more complex problem of weather forecasting.
- Weather forecasting is carried out in two stages: firstly, the possibility of fluctuations in the position and intensity of cyclones, pressure heights, fronts, movement, and development of air groups must be clarified, i.e. it is a forecast of Sinov topology;
- Second – determination of weather characteristics based on the topographic forecast of Sinov, taking into account a number of conditions by which we influence the weather.
- The formation of the position of Sinov in weather forecasting is of great importance because with the shift and chemistry of the progress of Sinov objects, the quantitative characteristics of the meteorological elements also change, and the nature of the weather itself changes.
The prediction of the Sinova shape is determined by both the numerical method and the Sinova method, moreover, the barometric field at high altitudes can only be calculated by numerical methods, which are significant both when calculating the calculation of the barometric field at sea level. - Method based on solving aerodynamic and thermodynamic equations using electronic computers. Initial data of atmospheric conditions for a number of points in the area of interest are entered into this equation and then integrated over time. Today, in the large meteorological centers of many developed countries, it is common to take a barometric attitude using the numerical law.
Sinov’s forecasting method
- This is the main method widely used for weather forecasting. The basis of this method is to extrapolate atmospheric processes that have taken place in the immediate and current time period, and must include the use of causal relationships between atmospheric processes.
Based on the laws of nature, based on the interaction and influence between factors, people predict the properties of Si-Nov objects in the future.
- In the approximation of the Sinov method, it is assumed that the transformation and displacement of the sinov objects in a certain period of time, which will be soon, will be the same as it happened shortly before.
- In the last 12 hours, the cyclone has moved to the northeast at a speed of 25 km/h and has not changed its intensity, then in the next 12 hours it will also move in the previous direction and maintain the same speed, maintaining its intensity, unless there is a strong event in the atmosphere, leading to a change in the above-mentioned conditions.
- In the evolutionary phase of Sinop objects, there are often sudden changes, so the extrapolation of the appearance of Sinop’s method, which does not always allow for the correct location and course of events of future Sinop subjects.
- People usually create Sinov predictions in the form of maps and they are called prediction maps. On these maps, plot the upcoming barometric fields above sea level and the positions of the fronts.
The main basis for creating forecast maps are analytical weather maps and some barometric topographic maps in the last and previous observation periods.
- After clarifying the latest weather conditions related to the positions and intensity of cyclones, pressure heights, fronts and the state of air groups, it is possible to make forecasts of meteorological factors, weather phenomena, which is the second level of forecasting.
- Humans make simultaneous and synchronous predictions of a whole range of meteorological factors because the amount of a the development of this element is organically related to other factors.
For example, if you want to make a correct forecast about cloud cover, it is necessary to know the values of temperature and humidity. Conversely, without knowing the amount of cloud cover, it is difficult to predict daily variations in heat and other factors.
- Forecast maps are typically compiled 12, 18, 24, 36, 48, and 72 hours ahead of the current viewing period.

Weather 01852 - Lowell MA

31°
clear sky
Feels like 25°05:47/19:38
34°F
/28°F
58%
1024 hPa
7 mi
5.75 mph


