
Freeze-Thaw Conditions
Freeze-Thaw Conditions

Freeze-thaw refers to freezing and thawing, typically concerning weather and natural phenomena. When water freezes, it expands and can cause damage to materials and structures.
When the temperature rises and the water thaws, the materials and arrangements may be damaged further.
This process can occur repeatedly and can cause significant damage over time, especially in areas where there are extreme temperature fluctuations.
In the context of the environment, freeze-thaw cycles can affect soil structure and erosion, as well as the behavior of plants and animals. In the context of infrastructure and building materials, freeze-thaw processes can lead to cracking, expansion, and other forms of damage.
It is essential to consider freeze-thaw effects when designing and building structures in areas with extreme temperature fluctuations.
Climate Change Indicators: Freeze-Thaw Conditions
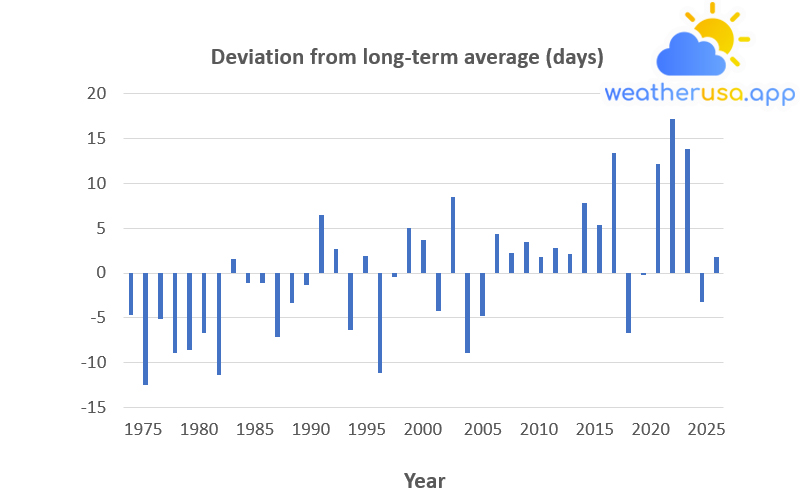
This figure shows the days the ground is ice-free in the 48 contiguous states compared with the average for 1979–2019. For each year, the bar represents the average number of days shorter or longer.
Positive numbers represent years with more unfrozen days than average. Choosing a different long-term average for comparison should not change the shape of the data over time.
| Year | Deviation from long-term average |
| 1979 | -4.65571 |
| 1980 | -12.4917 |
| 1981 | -5.15871 |
| 1982 | -8.90271 |
| 1983 | -8.63471 |
| 1984 | -6.63771 |
| 1985 | -11.3627 |
| 1986 | 1.576293 |
| 1987 | -1.14271 |
| 1988 | -1.10571 |
| 1989 | -7.12271 |
| 1990 | -3.38871 |
| 1991 | -1.29171 |
| 1992 | 6.512293 |
| 1993 | 2.684293 |
| 1994 | -6.34871 |
| 1995 | 1.882293 |
| 1996 | -11.1687 |
| 1997 | -0.38571 |
| 1998 | 4.988293 |
| 1999 | 3.670293 |
| 2000 | -4.27971 |
| 2001 | 8.467293 |
| 2002 | -8.89771 |
| 2003 | -4.79971 |
| 2004 | 4.357293 |
| 2005 | 2.225293 |
| 2006 | 3.420293 |
| 2007 | 1.782293 |
| 2008 | 2.767293 |
| 2009 | 2.178293 |
| 2010 | 7.869293 |
| 2011 | 5.315293 |
| 2012 | 13.38429 |
| 2013 | -6.67971 |
| 2014 | -0.20271 |
| 2015 | 12.13229 |
| 2016 | 17.15029 |
| 2017 | 13.80129 |
| 2018 | -3.26571 |
| 2019 | 1.759293 |
Figure 1. Number of Unfrozen Days in the Contiguous 48 States, 1979–2019
Data source: Kim and Kimball, 2020
Web update: April 2021
Units: days
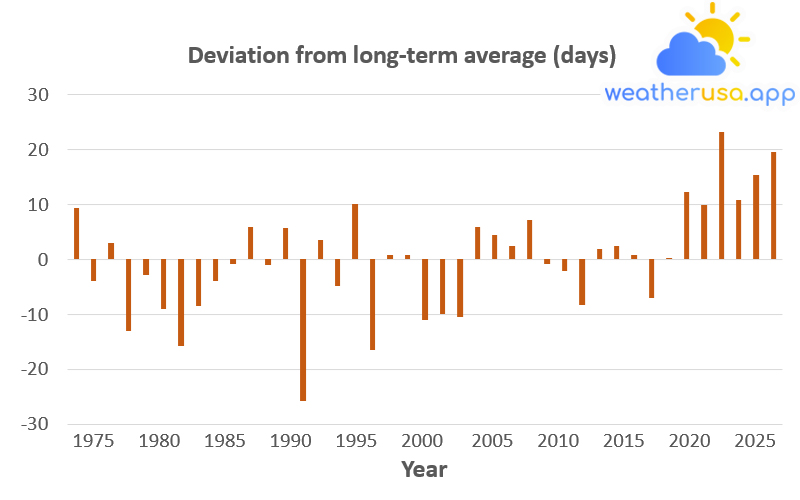
This figure shows the days the ground is ice-free in Alaska compared to the 1979–2019 average. For each year, the bar represents the average number of days shorter or longer.
Positive numbers represent years with more unfrozen days than average. Choosing a different long-term average for comparison should not change the shape of the data over time.
| Year | Deviation from long-term average |
| 1979 | 9.34461 |
| 1980 | -3.97739 |
| 1981 | 3.05361 |
| 1982 | -12.9554 |
| 1983 | -2.92239 |
| 1984 | -9.00139 |
| 1985 | -15.7454 |
| 1986 | -8.50439 |
| 1987 | -3.88339 |
| 1988 | -0.80939 |
| 1989 | 5.93961 |
| 1990 | -1.10539 |
| 1991 | 5.66461 |
| 1992 | -25.7944 |
| 1993 | 3.47861 |
| 1994 | -4.76539 |
| 1995 | 10.13261 |
| 1996 | -16.4494 |
| 1997 | 0.77361 |
| 1998 | 0.80461 |
| 1999 | -11.0144 |
| 2000 | -10.0344 |
| 2001 | -10.4824 |
| 2002 | 5.92061 |
| 2003 | 4.49061 |
| 2004 | 2.48261 |
| 2005 | 7.17561 |
| 2006 | -0.86939 |
| 2007 | -2.02839 |
| 2008 | -8.26439 |
| 2009 | 1.94361 |
| 2010 | 2.45561 |
| 2011 | 0.73761 |
| 2012 | -7.03039 |
| 2013 | 0.02261 |
| 2014 | 12.28261 |
| 2015 | 9.95861 |
| 2016 | 23.26361 |
| 2017 | 10.83261 |
| 2018 | 15.28961 |
| 2019 | 19.58961 |
Figure 2. Number of Unfrozen Days in Alaska, 1979–2019
Data source: Kim and Kimball, 2020
Web update: April 2021
Units: days
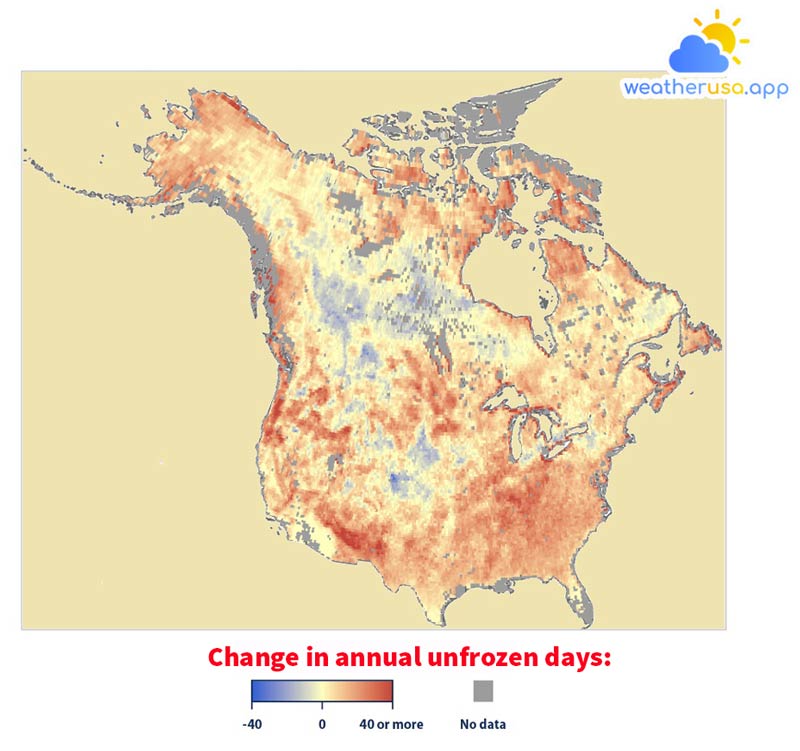
This map of North America shows the annual increase or decrease in the number of days without freezing from 1979 to 2019. The colors indicate the total change over these 40 years, based on the rate of change.
Long-term average. Dark gray areas are not included in this analysis because they are open water, barren land, permanently frozen, or seldom frozen ground.
Key Points
- In the 48 contiguous states, the number of freeze-free days in 2019 was close to the long-term average, but the four most minor frozen seasons on record occurred within the past ten years.
The freeze-free seasons of the 48 contiguous states have lengthened at an average rate of about four days per decade (see Figure 1). - In Alaska, 2019 had 20 more freeze-free days than the long-term average. 2016 has the most records.
Alaska’s frost-free season has lengthened at an average rate of about four days per decade (see Figure 2). - Across North America, the trend in non-freezing days is generally upward but varies widely with large-scale regional patterns (see Figure 3).
The number of days without freezing per year in the United States increased the most in parts of the West, South Central, and North Central states. Parts of Alaska and northern Canada have also seen significant increases in non-freezing conditions.
In contrast, some areas in the interior of the United States and Canada have experienced increased freezing for extended periods.
Background
- The freezing point is the critical temperature threshold for many aspects of life. The number of days with temperatures below freezing, and when these do occur, can affect natural ecosystems as well as many sectors of the economy. For example, many crops only grow when not constrained by frost damage.
- The number of freezing days a year determines which natural plants can thrive, what food sources are available to the animals, and when and how animals migrate or hibernate.
Freezing temperatures also help reduce populations of many insects and other pests that can damage crops and forests or transmit diseases to humans; conversely, a mild winter with fewer frost days could lead to more of these pests the following spring and summer.
Freezing temperatures also allow precipitation to fall in the snow rather than snow, not rain, which is essential for water supplies in the region and for places where winter activities, such as skiing and snowmobiling, are an indispensable part of the economy. - As the Earth’s climate has generally warmed, the number of freezing days has decreased in most parts of the United States.
A further reduction in the number of freezing days could lead to various impacts on ecosystems, drought, wildfire risk, agriculture, natural resources, and the economy.
About Indicators
- The index tracks the total number of ice-free days per year in the 48 contiguous states and Alaska based on satellite measurements that detect whether the land surface is frozen.
For a more expansive view, it also shows the results in a map of North America. It complements the EPA’s Growing Season Length indicator. Still, instead of relying on temperature thresholds, it provides a unique perspective based on ecologically relevant physical changes from data sources and different calculations.
This indicator focuses on whether the landscape is frozen and counts all freezing or non-freezing days throughout the year.
In contrast, the growing season indicator is based on air temperature and focuses on a continuous series of days between the last frost of spring and the first frost of autumn. - For this indicator, the “freezing day” is the opposite of the “frost day,” when icy conditions occur on the ground both morning and evening.
The index was developed by dividing the country into a grid of thousands of cells, using satellite measurements to calculate the number of freeze-free days in each cell each year, and then averaging all the regions’ grid cells. Figures 1 and 2 show the annual averages for the 48 contiguous states and Alaska.
These charts compare the number of freeze-free days per year with the 1979–2019 long-term average. Figure 3 shows the geographical average annual change over this period.
About the Data
Indicator Notes
- At any given location, the number of days to experience freezing varies yearly due to standard variations in weather patterns.
However, with almost four decades of data, the change should not affect the conclusions inferred from the long-term trends shown in this indicator. - A decrease in freezing conditions does not necessarily lead to a corresponding increase in agricultural productivity. This is because crop yields depend on crop-specific temperature thresholds, pollinating species, and seasonal water and nutrient availability constraints.
Agricultural production also depends on management activities and natural weather events like hurricanes. - This indicator differs from the EPA Growing Season Length indicator because it is based on satellite data, not terrestrial weather stations. It calculates the total number of freeze-free days throughout the year—not just the length of consecutive days between seasons’ last spring frosts and first autumn frosts.
Both indicators are helpful for different reasons, as the growing season is particularly significant for crops. At the same time, a broader consideration of freezing conditions is vital for understanding the effects of ecology, including biological and hydrological processes.
Additionally, the satellite method can collect local variations in areas where there may not be many long-term weather stations to measure air temperature.
The two indicators show similar patterns, consistent with multiple lines of evidence pointing to similar conclusions about the nation’s changing climate.
Data Sources
The EPA’s indicator is an updated version of an analysis originally published in the scientific literature in 2017.

Weather 01852 - Lowell MA

43°
overcast clouds
Feels like 40°05:56/19:31
45°F
/42°F
82%
1021 hPa
7 mi
4.61 mph


